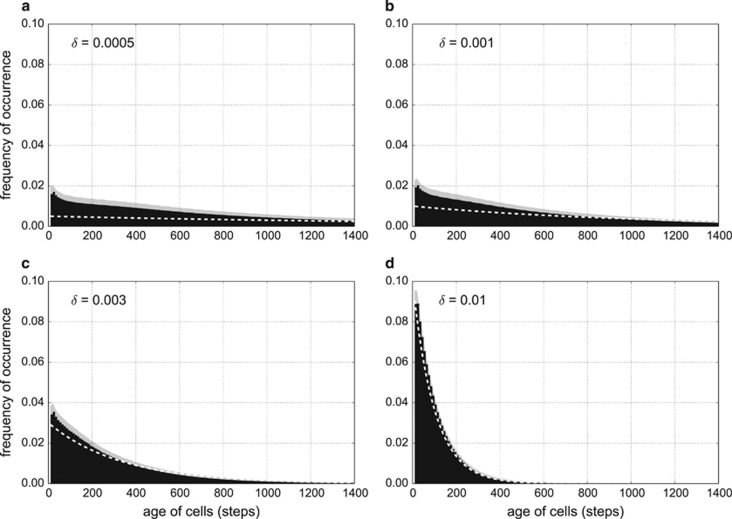
Figure 2.
Age structure of the population in various random death regimes. Numbers on the left of the panels show the value of the random death factor δ ((a)—0.0005, (b)—0.001, (c)—0.003, (d)—0.01). Black bars indicate fraction of the population of a particular age, shaded area indicates the s.d. White dashed line is given by the equation of the exponential distribution:  (Equation 7), where t is the time and 10 is a normalising term being the width of the histogram bins. All four runs have turbulence level T=0.25.

