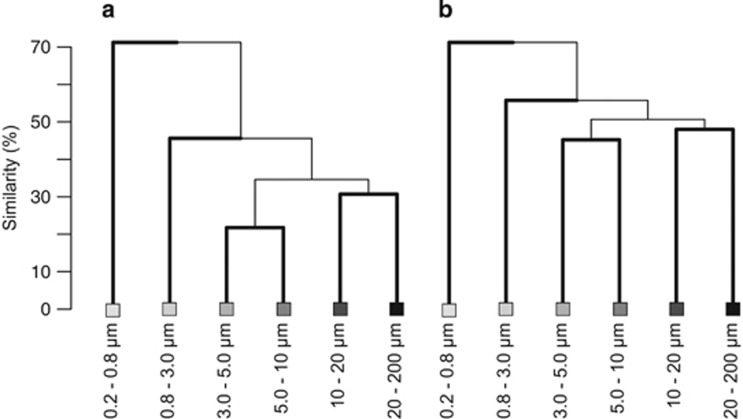
Figure 4.
Clustering dendrograms of the six size-fractions calculated by average clustering criteria (Unweighted Pair Group Method with Arithmetic Mean, UPGMA). Data used is the average of the distance between two size-fractions of the 8 months, with: (a) relative abundance data; and (b) presence–absence (binary) data. Thick lines indicate significant differences (determined by SIMPROF).

