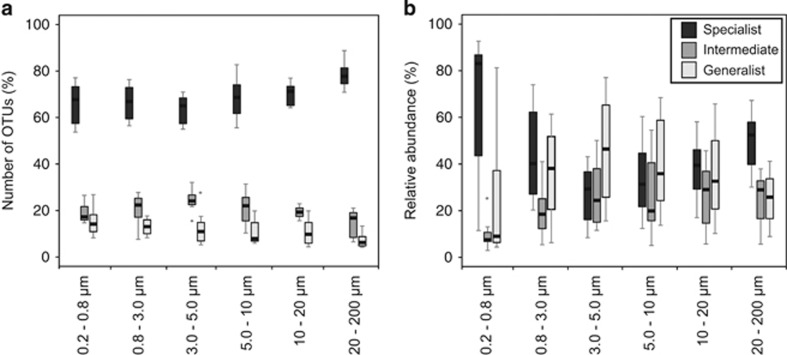
Figure 6.
Specialist, Intermediate and Generalist OTUs (see Material and Methods for definition) in each size-fraction, represented as: (a) number of OTUs; and (b) their relative abundances. The boxplots were constructed with the upper and lower lines corresponding to the first and third quartile of the distribution. The median values are shown with horizontal black wide lines. Outliers are displayed as dots.

