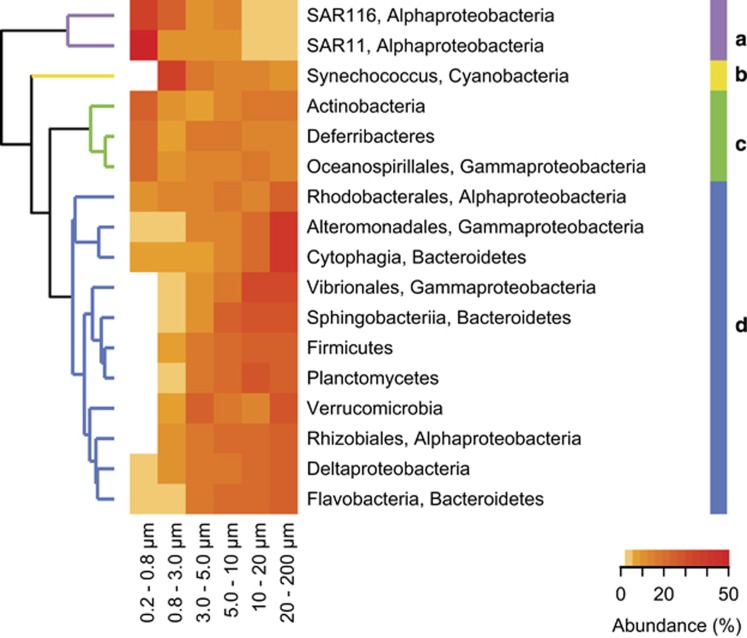
Figure 8.
Heatmap representing the relative abundances of individual taxonomic groups among size-fractions. The taxonomic groups were clustered hierarchically by the UPGMA method. A total of four categories were differentiated: (a) taxonomic groups enriched in the small size-fractions; (b) taxonomic groups enriched in increasing size-fractions, but depleted or absent in the smallest one (0.2–0.8 μm); (c) taxonomic groups that do not present enrichment in relation with the size-fraction; and (d) taxonomic groups enriched in increasing size-fractions. The data presented are the average of the 8 months.

