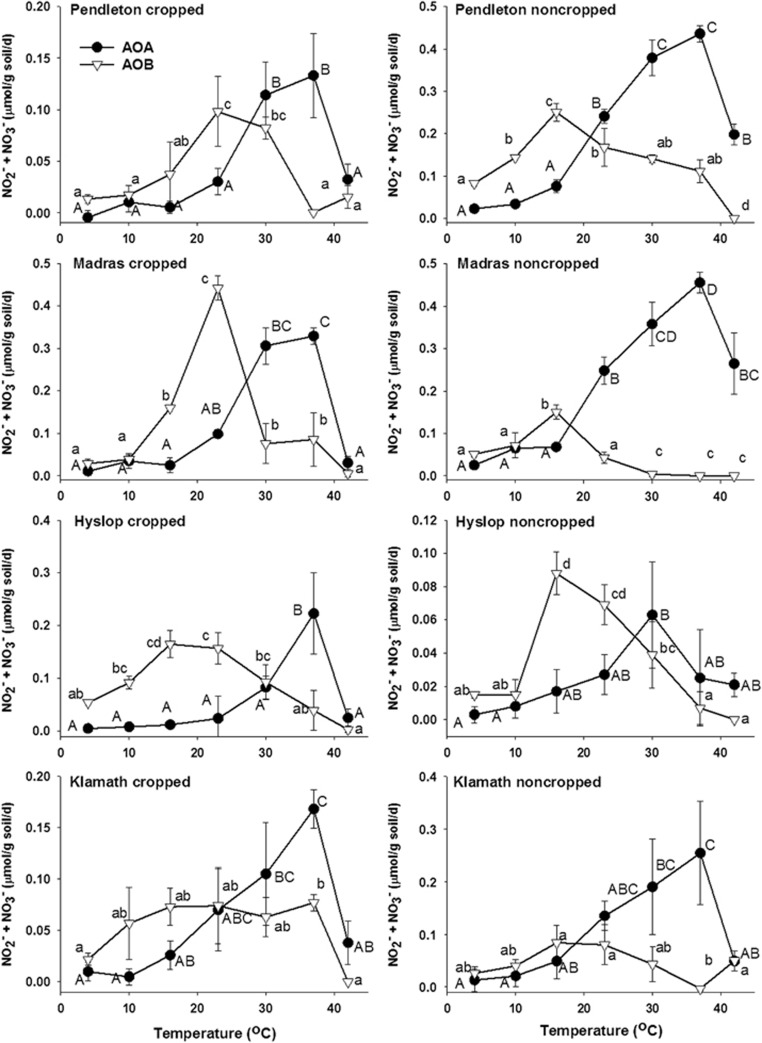
Figure 1.
Nitrification potential response of AOA and AOB in cropped and noncropped soils to a range of temperatures (4–42 °C). Symbols with error bars represent the s.d. of the average of three replicate measurements. Upper case letters indicate significant differences (P<0.05) in rates of nitrification by AOA at each temperature. Lower case letters indicate significant differences (P<0.05) between rates of nitrification by AOB at each temperature. Temperatures that have letters in common were not significantly different.

