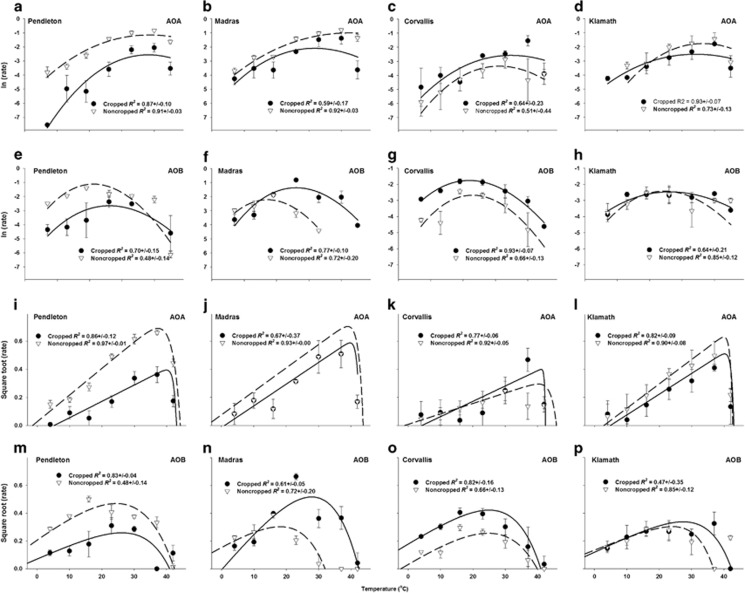
Figure 2.
The fit of the MMRT (a–h) and SQRT (i–p) models to rates of NO2−+NO3− production by AOA and AOB in cropped (solid lines) and noncropped (broken lines) using the average of the model fit from each replicate. Symbols with error bars represent the s.d. of the average of the experimental data.

