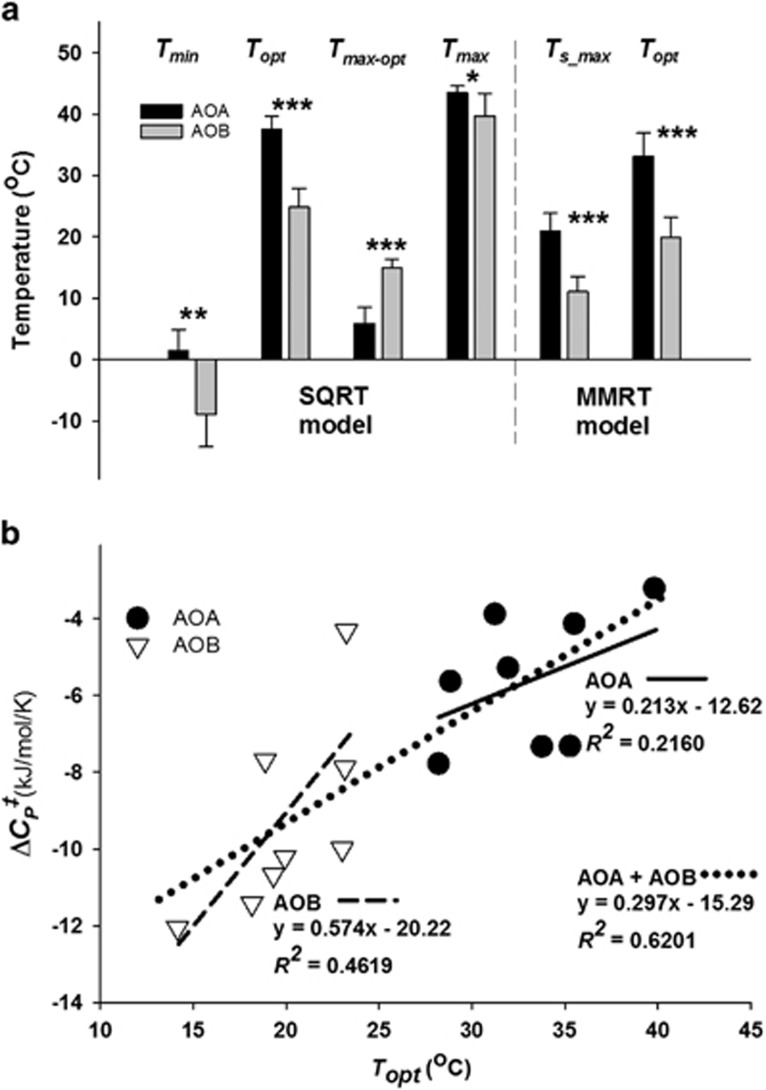
Figure 3.
Significant outcomes from modeling the NP response to temperature in eight Oregon soils. (a) SQRT and MMRT model parameters that had significantly different values for NO2−+NO3− production by soil AOA and AOB. The pairs of bars represent the average of the mean AOA or AOB value of a given parameter, and error bars represent the s.d. The asterisks assign the level of significance to each pair of bars (*P<0.01, **P<0.001, ***P<0.0001). (b) Comparison of the ΔCP‡–Topt–relationships of AOA and AOB in soil. Symbols represent the values for individual soils. The dotted regression line demonstrates the ΔCP‡–Topt–relationship for all AOA and AOB values across the entire temperature range. The solid and dashed regression lines are for the AOA and AOB ΔCP‡–Topt relationship, respectively.

