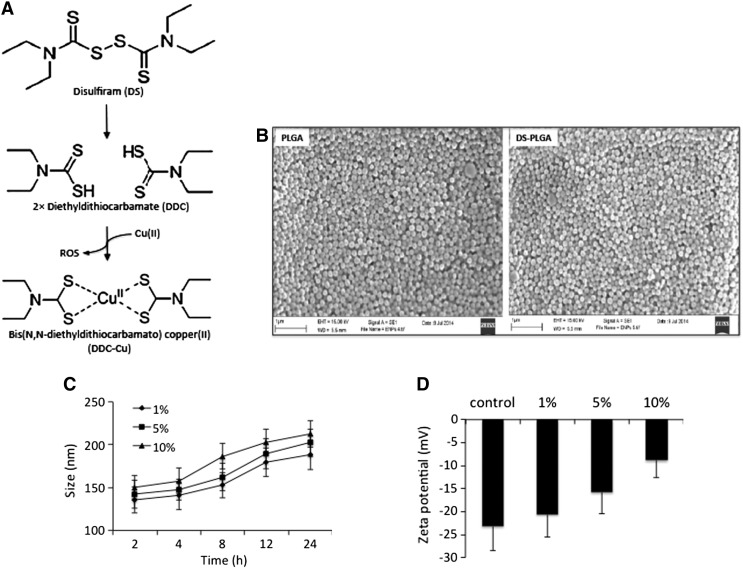
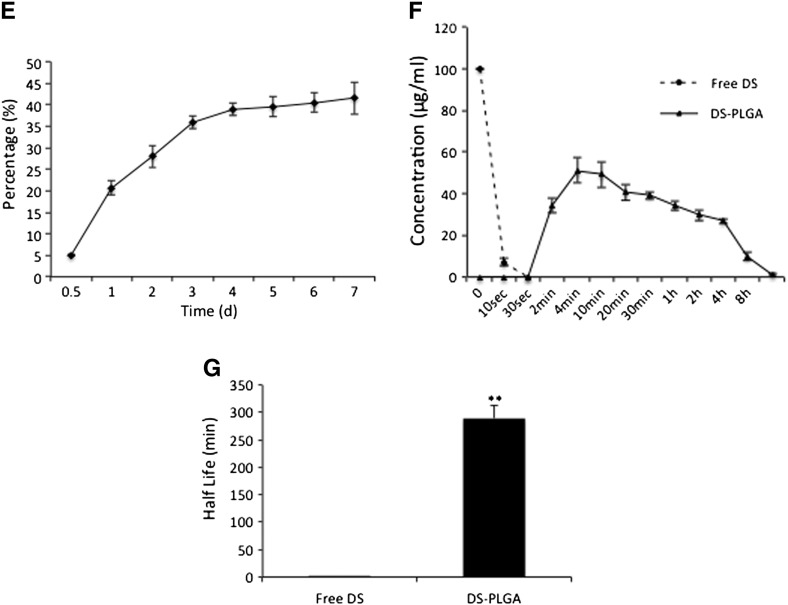
Figure 1.
In vitro characterization of DS-PLGA. (A) The scheme of DS metabolism and reaction with copper(II). (B) Scanning electron micrographs of PLGA and DS-encapsulated PLGA (DS-PLGA). (C) The influence of serum concentration on the size of DS-PLGA. (D) The influence of serum concentration on zeta potential. (E)In vitro release profiles of DS. (F)In vitro half-life of DS in horse serum. (G) The in vitro half-life of free DS and DS-PLGA in horse serum. **P < 0.01.


