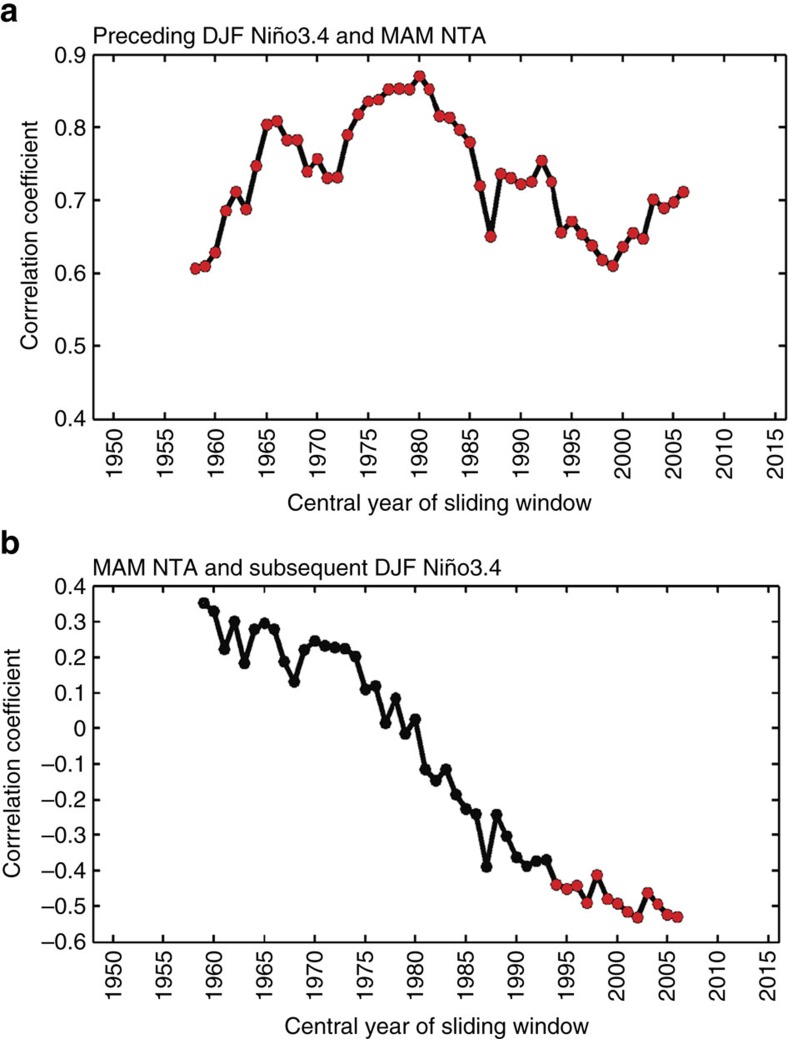
Figure 1. Correlations between the ENSO and NTA SST indices.
(a) The 21-year sliding correlation coefficients (for example, correlation coefficient in 2002 representing 1992–2012) between preceding boreal winter (DJF) Niño3.4 and spring (MAM) NTA SST during 1948–2016. (b) Same as a but for MAM NTA SST and subsequent DJF Niño3.4. Following ref. 20, the impact of the previous winter ENSO has been excluded in b by removing the linear regression with respect to the Niño3.4 index during the previous DJF season. The linear trend has been removed within each sliding window for both indices before calculating the sliding correlation coefficients. The red dots represent correlations that are significant at the 95% confidence level.

