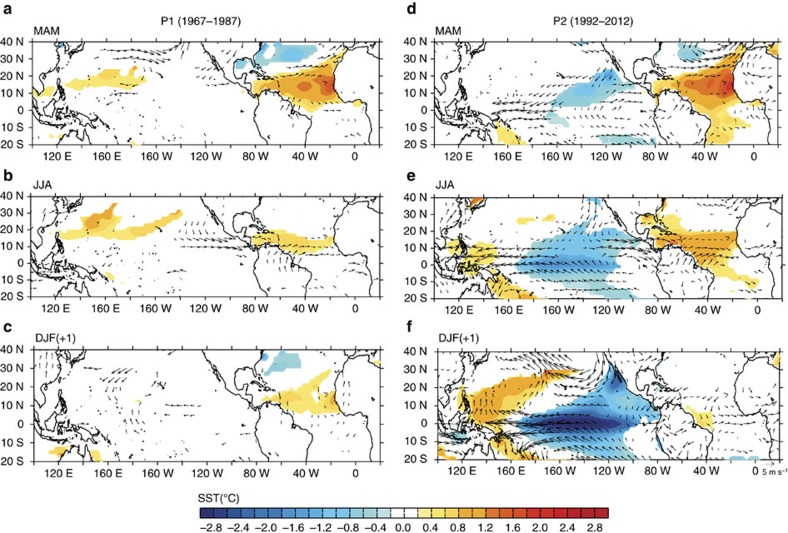
Figure 3. Regression with respect to spring NTA SST.
(a–c) Regressions of SSTAs (shading) and 850-hPa winds (vector) with respect to the MAM NTA SST during P1 for MAM (a), JJA (b) and DJF (c) seasons. (d–f) Same as a–c but for during P2 for MAM (d), JJA (e) and DJF (f) seasons. The impact of the previous winter ENSO has been excluded by removing the linear regression with respect to the Niño3.4 index during the previous DJF season. Only the values at the 90% confidence level or higher are shown.

