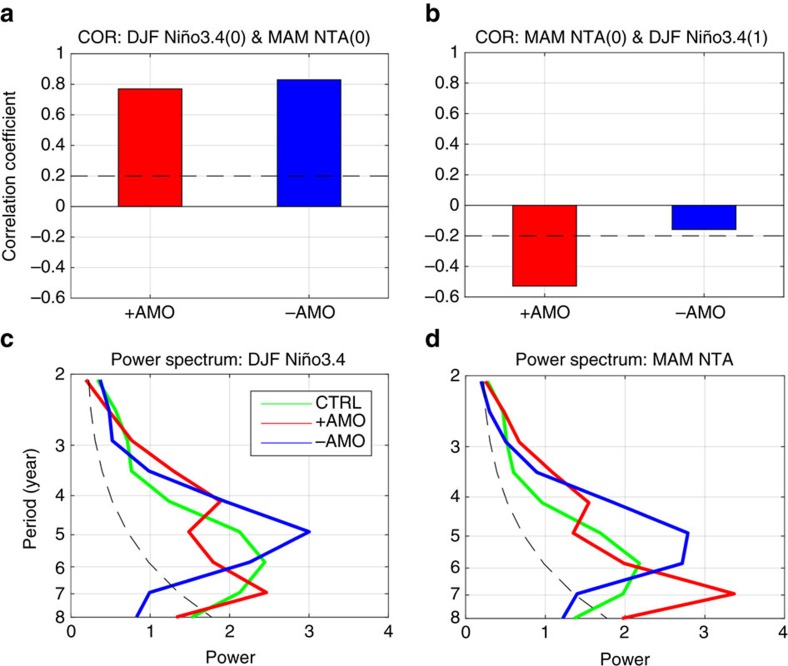
Figure 5. Changes in the effectiveness of the Atlantic capacitor effect in numerical experiments with different AMO phases.
(a) The ‘charging' process represented by the correlation coefficients between the winter Niño3.4 index and the following spring NTA index in the positive-AMO run and the negative-AMO run. The dashed line denotes the 95% confidence interval. (b) The ‘discharging' process represented by the correlation coefficients between the spring NTA index and the subsequent winter Niño3.4 index. The previous winter Niño3.4 regressions had been removed from NTA index before calculating coefficient. (c) Power spectra of the winter Niño3.4 indices in CTRL, positive and negative-AMO runs. The dashed line denotes the 95% confidence interval against red noise. (d) As in c but for the spring NTA indices.

