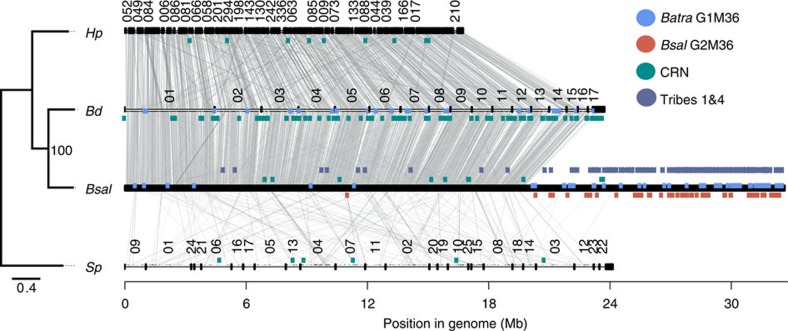
Figure 1. Relationship and genomic organization of four chytrid species.
A phylogenetic tree inferred using RAxML indicates the relationships of the four chytrids (branch lengths indicate the mean number of nucleotide substitutions per site). To the right is a synteny plot, visualizing regions that span two or more orthologs between any two species as a connected grey line. Scaffold numbers are shown above each genome axis if longer than 100 kb, and the location of Batra. Group 1 M36s (G1M36), Bsal Group 2 M36s (G2M36), Crinklers (CRN) and the secreted upregulated Tribes 1 & 4 are depicted with coloured bars.

