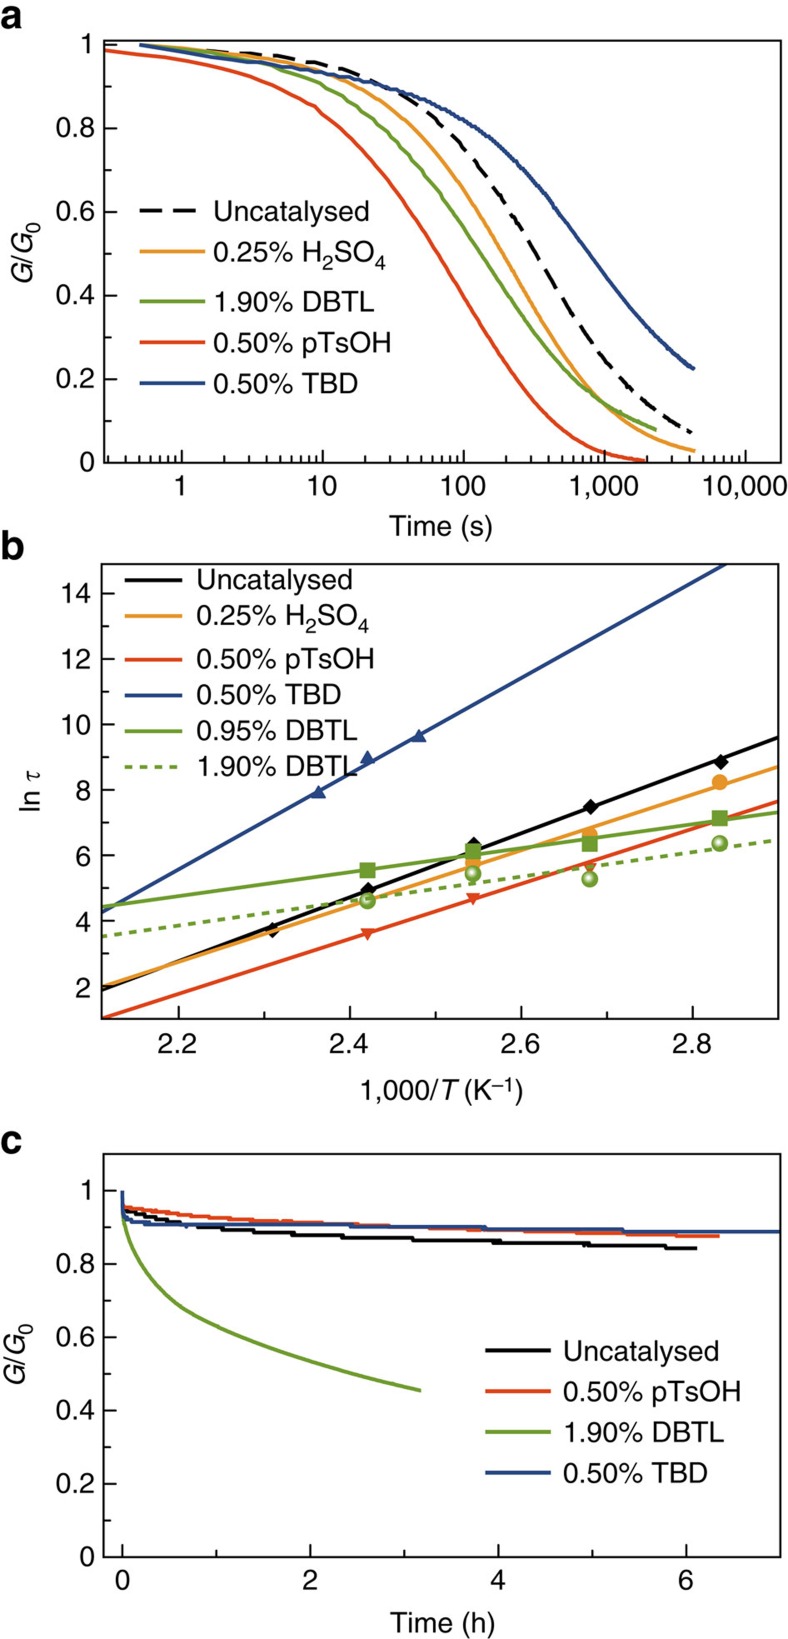
Figure 4. Rheology of the VU vitrimer elastomers.
(a) Stress–relaxation experiment for networks with acid and base additives at 120 °C and a deformation of γ=5%; (b) Arrhenius plot for samples loaded with catalysts. The amount of catalyst was calculated as mol% versus the amine functionalities in the initial monomer mixture; (c) Stress–relaxation experiments at 30 °C and a deformation of γ=5%.

