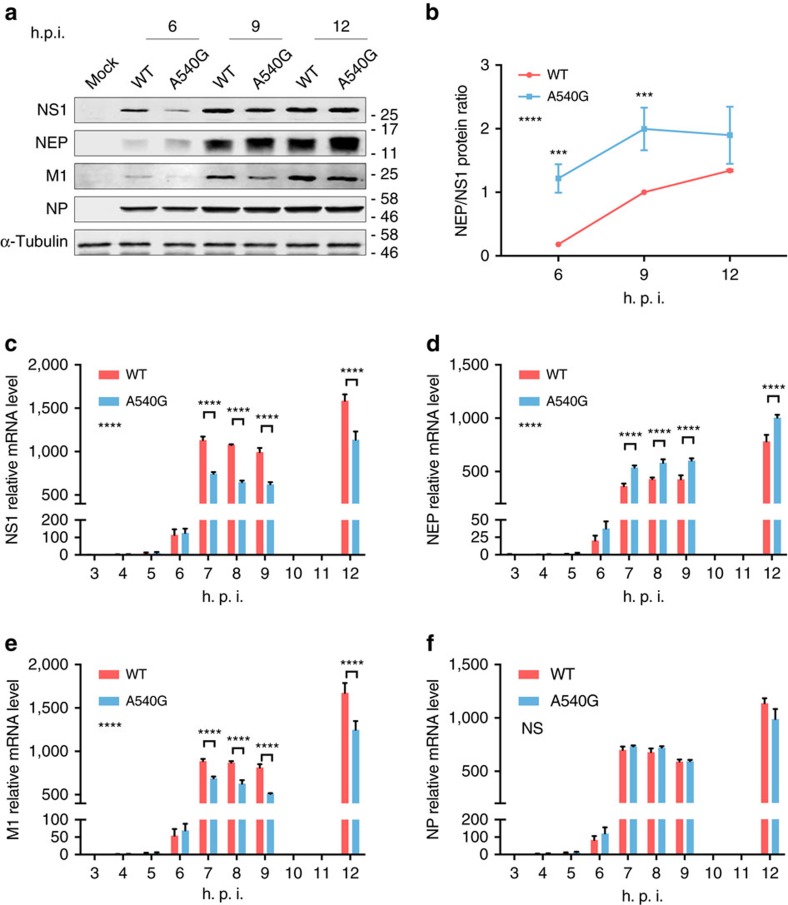
Figure 3. Effect of A540G substitution on viral protein expression and mRNA transcription.
(a) Whole-cell lysates of A549 cells infected with the indicated H9N2 viruses (multiplicity of infection (MOI)=1) were analysed by immunoblotting with antibodies against NS1, NEP, NP, M1 and α-tubulin. Expression of viral proteins at different time points is shown. (b) The ratio of NEP to NS1 proteins at different time points was calculated using quantification data obtained using Image-J software (a). Band intensity of NS1 or NEP are relative to those of WT at 9 h.p.i. Error bars represent mean±s.d. (n=3). (c–f) Total RNA from A549 cells infected with the indicated viruses at an MOI of 1 was isolated. NS1 (c), NEP (d), M1 (e) and NP (f) mRNAs were measured by RT–qPCR and normalized to β-tubulin levels. Error bars represent mean±s.d. (n=3). Statistical significance was analysed by two-way analysis of variance with Bonferroni post test: ***P<0.001 and ****P<0.0001; NS, not significant. Symbols on the left of the graphs indicate the statistical significance of the comparison between WT and A540G groups. Full-size western blottings are provided in Supplementary Fig. 8.

