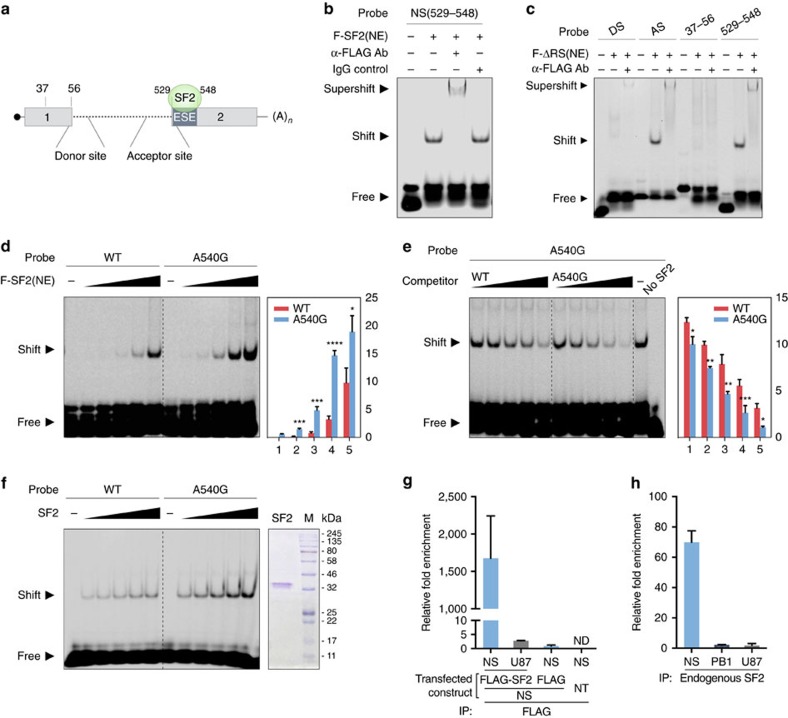
Figure 4. SF2/ASF interacts with NS mRNA through multiple binding sites including the ESE motif and A540G substitution enhances SF2 binding to NEP ESE.
(a) Schematic illustration of the SF2/ASF-binding sites in NS mRNA and locations of probes used in the following experiments. (b) SF2/ASF binds to NS (529–548), in which the putative ESE is located, in RNA EMSA using NE containing FLAG-tagged SF2/ASF. α-FLAG antibody was used for super-shifting and IgG was used as a control antibody. (c) Different regions of NS mRNA bound by SF2/ASF were analysed by RNA EMSA using FLAG-SF2ΔRS. RNA probes derived from the splicing donor site (DS), acceptor site (AS), exon-1 (37–56) and exon-2 (529–548) of NS mRNA were similarly tested, as in b. (d) SF2 binding efficiency to WT and A540G mutant ESE was compared in RNA EMSA with increasing amounts of FLAG-SF2 NE. (e) Competition efficiency with WT or A540G cold probes was compared in RNA EMSA with increasing amounts of cold probes (competitors). Results displayed in d,e are representative of three separate experiments. Error bars represent mean±s.d. (n=3). Statistical significance was analysed by Student's t-test: *P<0.05, **P<0.01, ***P<0.001 and ****P<0.0001. (f) SF2 was purified by IP in high-salt RIPA buffer using α-FLAG antibodies and the purity of FLAG-SF2 verified by Coomassie blue staining. Efficiency of SF2 binding to WT and A540G mutant ESEs was compared in RNA EMSA with increasing amounts of purified FLAG-SF2. The relative intensity of the shifted bands was quantified using Image-J and is shown at the right side of each graph (d,e). (g) RNA-IP assay with lysates prepared from pHW2000-H7N9-NS transfected cells co-transfected with FLAG-SF2, FLAG-vector or mock transfected (NT). Whole-cell lysates of HEK293T cells were prepared at 48 h post transfection and subjected to IP with α-FLAG. (h) RNA-IP assay in virus infected cells. Whole-cell lysates were prepared from A549 cells infected with rH9N2-WT virus (multiplicity of infection (MOI)=2) at 16 h post infection and subjected to IP with α-SF2/ASF (endogenous). (g,h) RNA-IPs were followed by RNA extraction and RT–qPCR with primers detecting viral NS, cellular U87 scaRNA or viral PB1 mRNA. Fold enrichment of mRNA was calculated by the ΔCt method. The error bars represent mean±s.d. (n=3).

