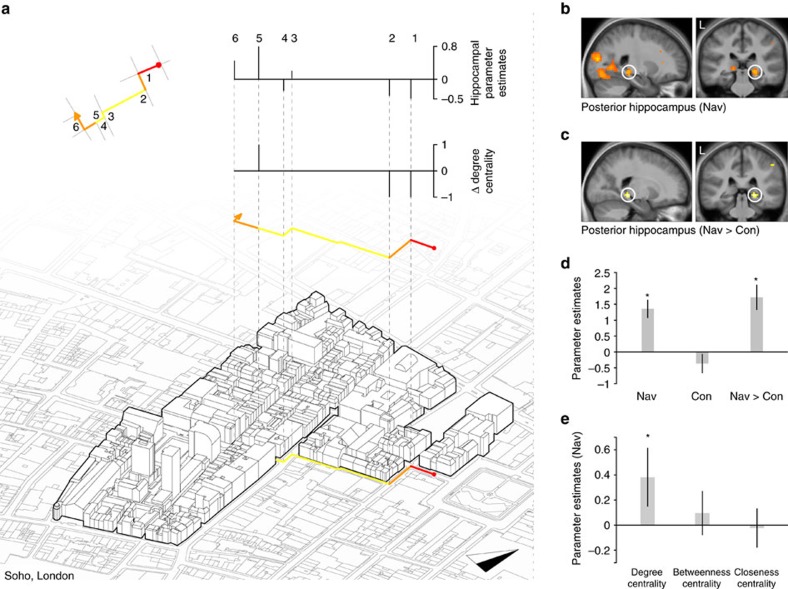
Figure 3. Posterior hippocampal activity is correlated with the change in degree centrality during navigation.
(a) Top left: degree centrality plotted for each street segment for an example route (see Fig. 2c). Right: axonometric projection of the buildings in Soho plotted on a map of Soho. Degree centrality of the route is plotted on the map and projected above. Above the route the graph plots the change in degree centrality for each boundary transition and the top graph plots the evoked response in the right posterior hippocampus at each of the individual boundary transitions (1–6). Analysis of this plot was not used for statistical inference (which was carried out within the statistical parametric mapping framework), but is shown to illustrate the analytic approach. (b,c) Right posterior hippocampal activity correlated significantly with the change in degree centrality for Navigation and Navigation>Control during Street Entry Events. Statistical parametric maps are displayed with threshold P<0.005 uncorrected on the mean structural image. (d) Parameter estimates for the mean activity in the right posterior hippocampus ROI for Navigation (t23=4.24, P=0.0003), Control (t23=1.17, P=0.25) and Navigation>Control (t23=4.64, P=0.0001) comparisons for a model containing categorical change in degree centrality (see Supplementary Table 2). (e) Parameter estimates for the mean activity in the right posterior hippocampus ROI for Navigation>Control condition for a model containing degree centrality (t23=2.28, P=0.03), betweenness centrality (t23=0.53, P=0.59) and closeness centrality (t23=0.14, P=0.88) measures (Supplementary Table 3 and Supplementary Fig. 3). Error bars denote the s.e.m. See Supplementary Fig. 4C for anterior hippocampal ROI mean responses.

