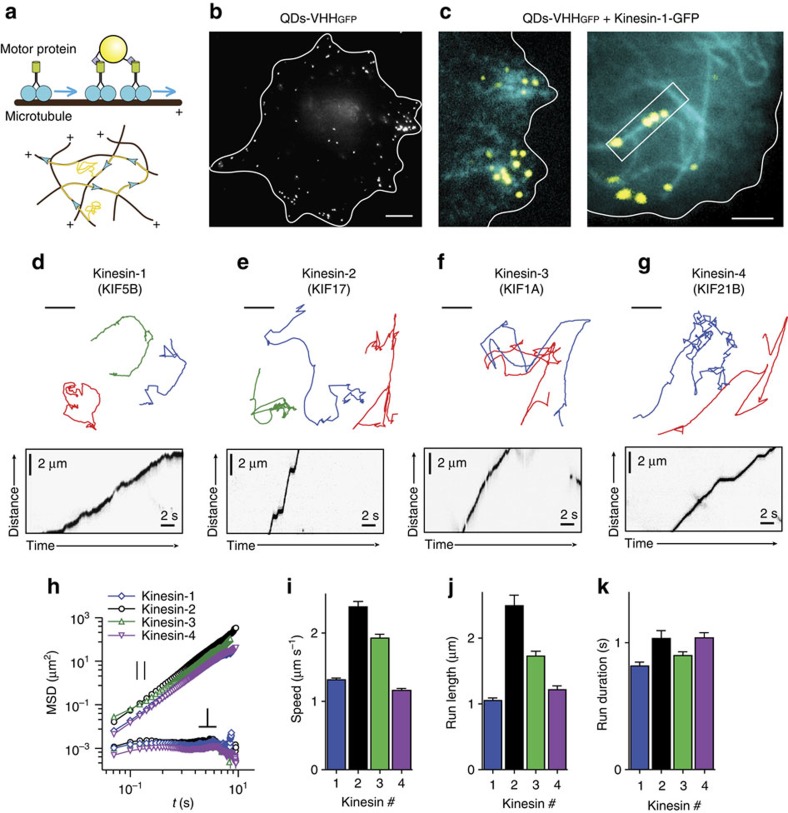
Figure 2. Probing specific motor proteins using nanobody-conjugated QDs reveals limited transverse fluctuations during microtubule-based runs.
(a) Linkage of QDs to GFP-fused motor proteins through GFP nanobody (top) and expected movement of individual QDs-kinesin complexes along microtubules (bottom). (b) Distribution of electroporated QDs–VHHGFP inside COS-7 cell expressing kinesin-1-GFP (cyan) and electroporated with QDs–VHHGFP (yellow). White curve indicates cell outline. Scale bar, 5 μm. (c) QDs–VHHGFP colocalize with microtubules decorated by kinesin-1 (KIF5B-GFP-FRB). Single frames from TIRFM stream recordings of COS-7 cell expressing kinesin-1-GFP (cyan/right) and electroporated with QDs–VHHGFP (yellow). Scale bar, 2 μm. (d–g) Example trajectories (top row) and kymographs (bottom row) for QDs coupled to kinesins from different families. Scale bars, 2 μm and 2 s. (h) Average MSD of longitudinal (top) and transverse (bottom) components of directed motion segments of different kinesins (n=104, 146, 151, 144 for Kinesin-1,2,3,4) decomposed using B-spline trajectory fitting with 1 μm control points distance. (i–k) Average speed i, run length j and run duration k of the individual motor runs for the different kinesins. Error bars represent s.e.m. See Supplementary Table 3 for numeric values.

