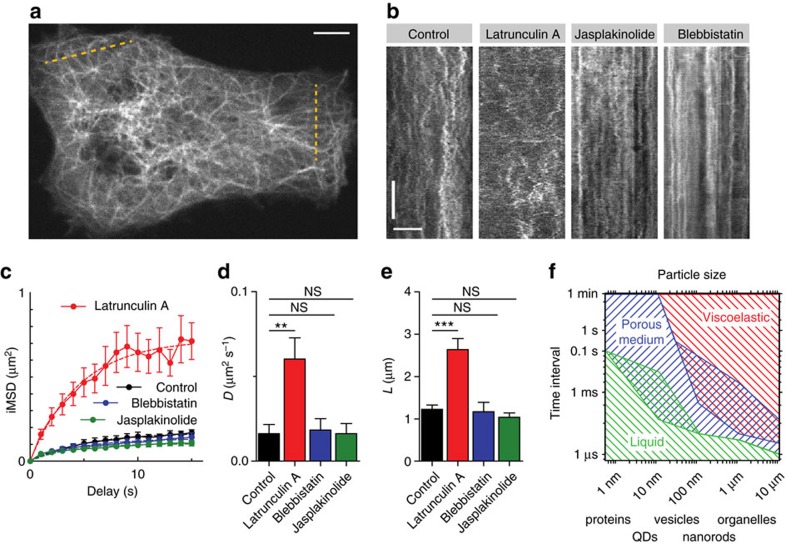
Figure 4. Analysis of microtubules bending deformations under the treatment of F-actin modifying drugs.
(a) Still from a spinning disk movie of COS-7 cells expressing mCherry-tubulin. Dashed yellow lines mark areas used to build kymographs. Scale bar, 5 μm. (b) Representative kymographs built from spinning disk movies of COS-7 cells transfected with mCherry-tubulin under the treatment of indicated drugs. Scale bars, 60 s (vertical) and 5 μm (horizontal). (c) Plot of average iMSD versus time derived from kymograph analysis (N=11, 10, 14 and 13 for control, 10 μM latrunculin A, 10 μM jasplakinolide and 50 μM blebbistatin treatment). Error bars represent s.e.m. (d) Average diffusion coefficient derived from individual fitting of iMSD curves for indicated conditions. **P<0.01 (two-tailed Mann–Whitney test), n>=9, each group. Error bars represent s.e.m. (e) Average confinement size derived from individual fitting of iMSD curves for indicated conditions ***P<0.001 (two-tailed Mann–Whitney test), n≥9, each group). Error bars represent s.e.m. (f) Hypothetical phase diagram reflecting the behaviour of intracellular particles and cellular components of different sizes on different timescales.

