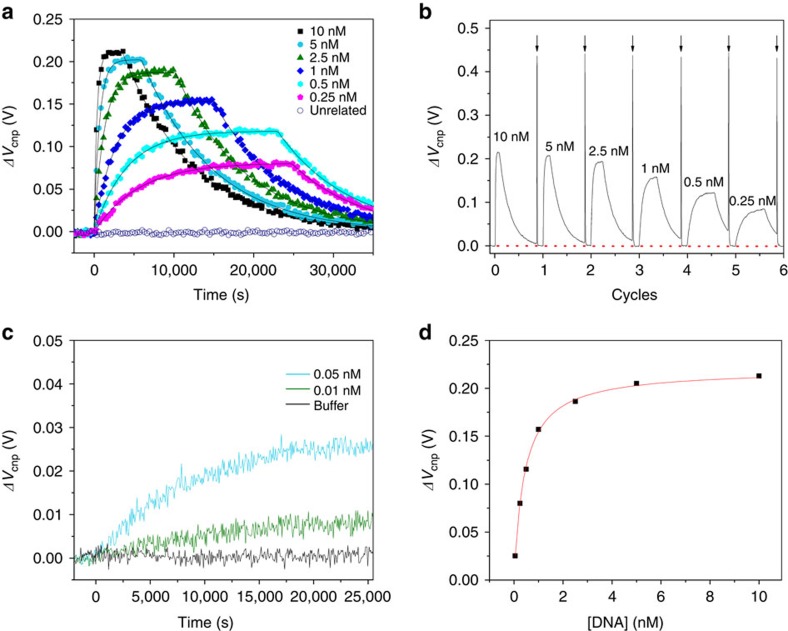
Figure 3. DNA–DNA binding using the G-FET in 0.01 × PBS buffer.
(a) Real-time sensor responses of G-FET to DNA hybridization and dissociation. Each curve represents the measurement of a different T20 DNA concentration from channel 1. The kinetic data for a DNA sequence unrelated to the probe DNA P20 at 5 nM is shown as a control (blue open circles). (b) Multiple hybridization cycles upon exposure to the target DNA sequences of T20 at different concentrations. The arrows indicate the timing for the injection of 10 mM NaOH and subsequent rinse by the pure 0.01 × PBS buffer. The initial baseline current of the functionalized G-FET is marked by a red dotted line. (c) Kinetic curves of the DNA hybridization at 0.05 and 0.01 nM of T20. (d) The maximal sensor response ΔVcnp as a function of DNA concentration in channel 1 along with the curve fitting by equation (10).

