Figure 1.
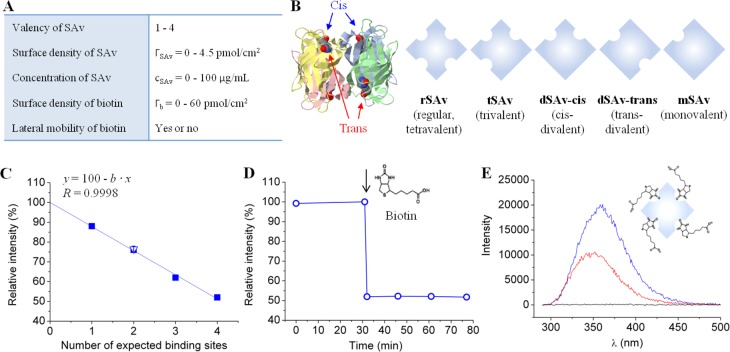
Tunable model system to study SAv binding to biotinylated surfaces. (A) Table of tunable parameters. (B) SAv constructs having different valencies. On the left, the structure of the SAv tetramer (ribbon diagram with each monomer in distinct color) with biotins attached to its binding pockets (ball-and-stick model) is shown; on the right, the SAv constructs used are listed schematically. (C–E) Fluorescence measurements in the presence of biotin in solution reveal the number of binding sites in SAv constructs. (C) Relative fluorescence emission intensity of tryptophan located in the binding pockets of rSAv, tSAv, dSAv-trans, mSAv (filled squares, each data point represents a single measurement) and dSAv-cis (empty triangle, mean of 2 measurements with standard error) upon biotin binding to saturation. All data fall onto a straight line (linear fit) that crosses the y axis at 100%. (D) Example of tryptophan relative intensity change upon biotin binding to SAv (the moment of biotin injection is indicated by an arrow). This data set corresponds to the last point in (C). (E) Examples of fluorescence spectra. Here, tryptophan fluorescence emission spectra of rSAv solution in the absence of biotin (blue) and 45 min after biotin injection (red) are shown, and the maxima in these spectra correspond to the first and last points, respectively, in (D). A negative control (i.e., biotin without SAv) is also shown (black).

