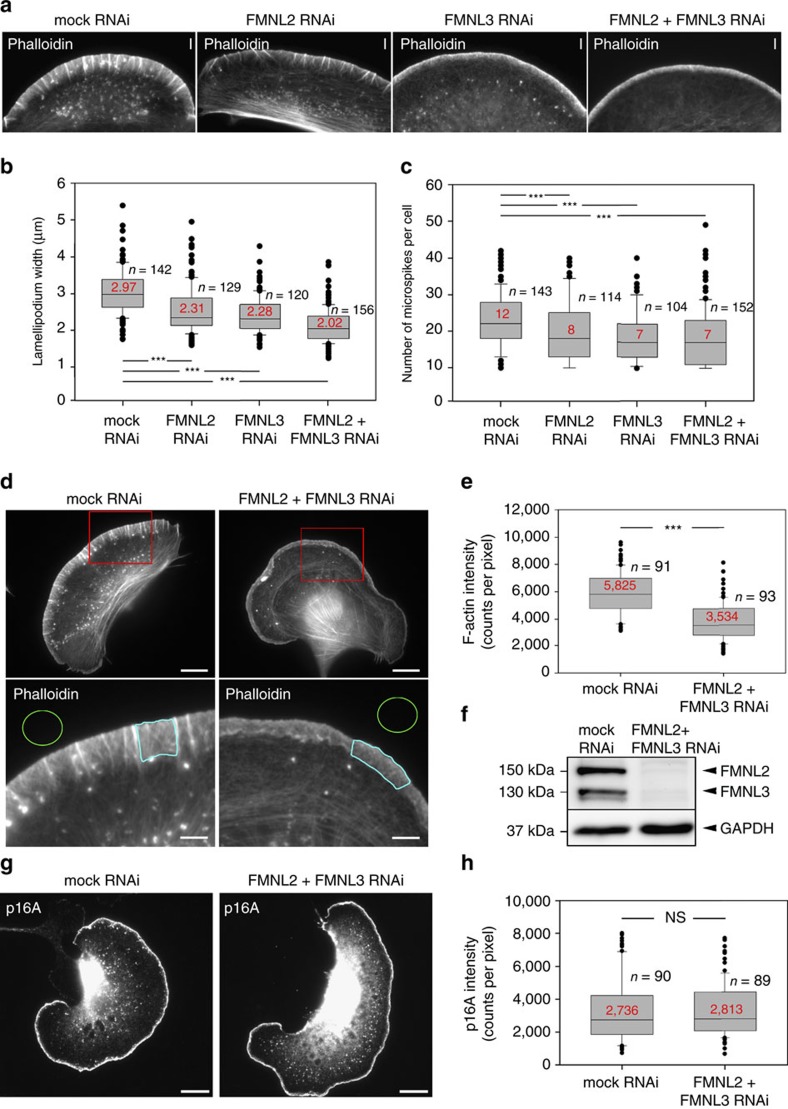
Figure 3. RNAi-mediated knockdown of FMNL2 and -3 reduces lamellipodium width, microspike number and F-actin intensity.
(a) Representative examples of lamellipodia from mock, FMNL2, FMNL3 or FMNL2+FMNL3 RNAi-treated B16 cells fixed and phalloidin-stained during migration on laminin. Bars, 3 μm. (b,c,e) Quantification of lamellipodium width (μm), microspike number and F-actin intensity in lamellipodia (photon counts pixel−1 after background subtraction) in cells treated as in a. Results are displayed as box and whiskers plots with median values given in red, boxes including 50% (25–75%) and whiskers 80% (10–90%) of all measurements; outliers are shown as dots. n, number of cells analysed. (d) Examples of phalloidin-stained B16 cells RNAi-treated as indicated, and employed for quantification of F-actin intensity. Red rectangles in top panels indicate magnified insets shown at the bottom. Areas framed in turquoise depict representative regions within lamellipodia used to measure F-actin intensities, and green circles extracellular regions defined as background. Scale bars in upper and lower panels equal 10 and 3 μm, respectively. (f) Representative western blot illustrating RNAi-mediated knockdown efficiency from samples collected in parallel to cells used in b,c,e. (g) Immunolabelling of the Arp2/3 complex subunit p16A (ARPC5A) in RNAi-treated cells as indicated. Bars, 5 μm. (h) Quantification of Arp2/3 complex intensities in lamellipodia of mock- and FMNL knockdown cells, displayed as described in b,c,e. ***p<0.001 by Mann–Whitney rank sum test.

