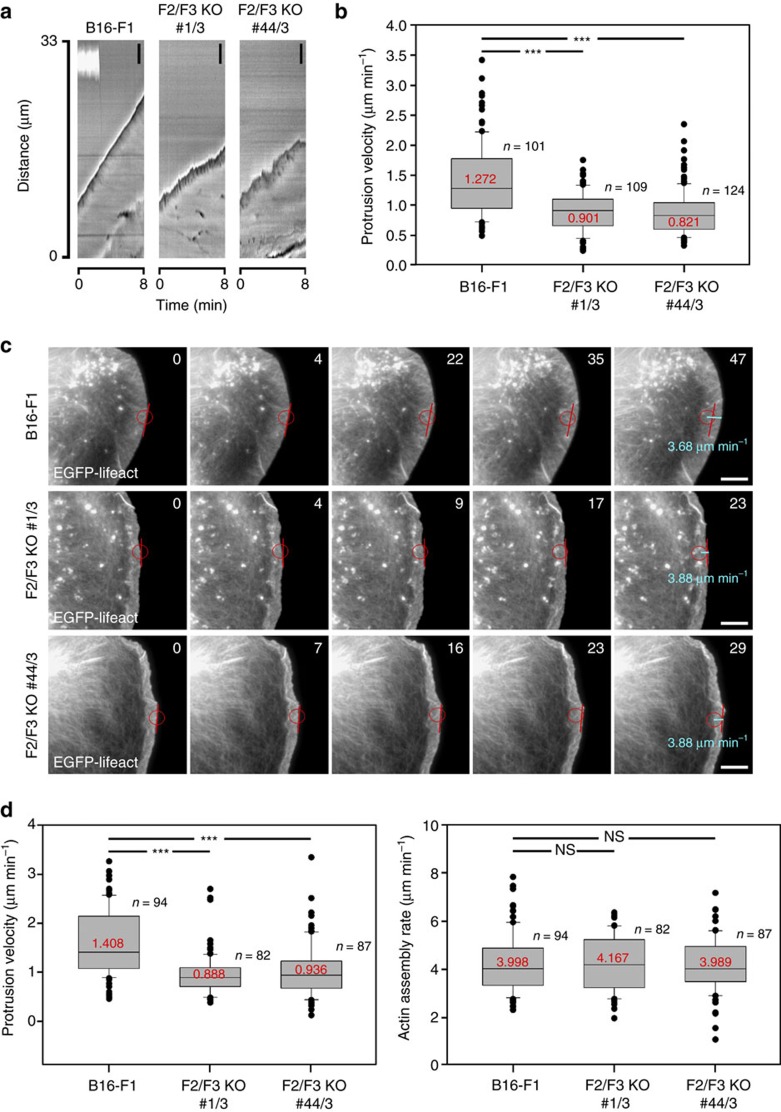
Figure 5. Reduced protrusion in FMNL2/3 KO is not caused by decreased network polymerization.
(a) Representative kymographs demonstrating lamellipodial protrusion of FMNL2/3 knockout cells compared to B16 controls. Note that protrusion in case of F2/F3 KO#1/3 and F2/F3 KO#44/3 is much less smooth as usually seen with control B16 (left panel). Bars equal 3 μm. (b) Box and whiskers plots depicting average protrusion velocity (μm min−1). Red numbers denote medians of respective data sets; n gives the number of cells analysed. (c) Time-lapse frames of B16 and respective FMNL2/3 KO clones transfected with EGFP-lifeact. Images show sections of respective lamellipodia before and during tracking of fluorescence inhomogeneities performed to determine lamellipodial actin assembly rates; for experimental detail, also see legend to Supplementary Fig. 8c. Time is in seconds, bars equal 5 μm. (d) Average protrusion velocities (left panel) or actin assembly rates (right panel) of respective cell types expressing EGFP-lifeact. Box and whiskers plots are as shown in b. In spite of significant reduction of average protrusion velocities in FMNL2/3 KO lines (left panel), the rate of lamellipodial actin assembly is almost identical (right panel). ***p<0.001 by Mann–Whitney rank sum test.

