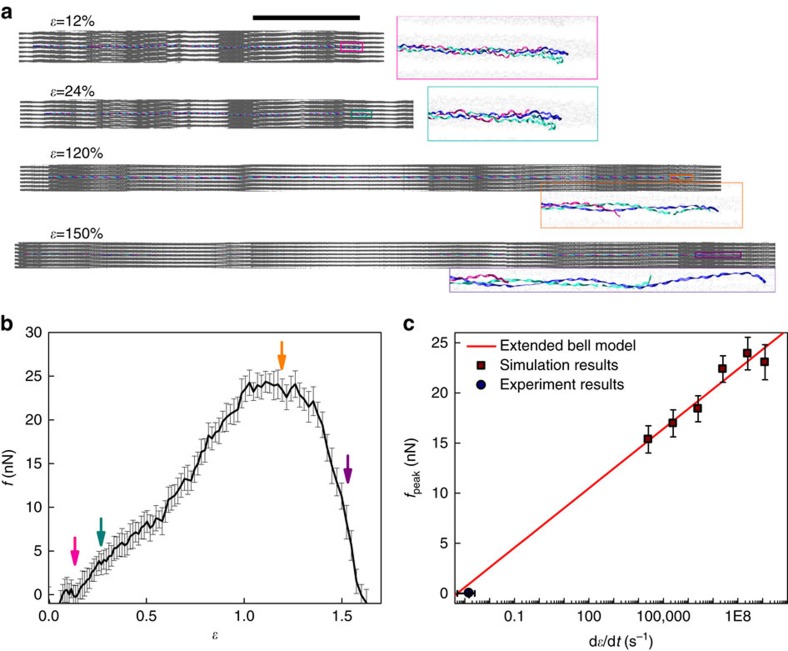
Figure 7. Simulations of tensile strain applied to confined full-length collagen.
(a) MD simulation snapshots of the mechanical response of the full-length collagen confined in a microfibril under deformations of different strains. Close-ups of the C-terminus of the center molecule are inserted for different strain states with other molecules displayed by gray points as the coordinates of their backbone atoms. Water molecules and ions are not show for clarity. Scale bar, 100 nm. (b) The force–strain (f-ɛ) curve of the center collagen molecule under uniaxial deformation with a strain rate of 108 s−1. The plot and error bar are results of average value and s.d. with a 40 ps window width. Snapshots in a are indicated by arrows in the plot with corresponding colors. (c) The peak force (fpeak) of the f–ɛ curve measured under different strain rates (dɛ/dt) in simulations (mean±s.d.). Data points are fitted according to an Extended Bell Model.

