Figure 4.

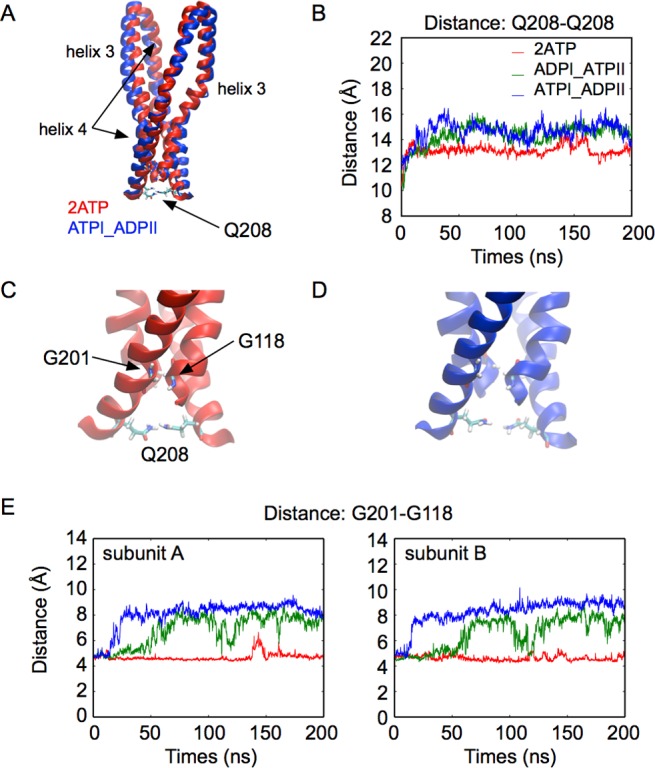
ATP hydrolysis at one binding site influences helix 3 and helix 4 in both subunits. A: Helix 3 and helix 4 in a superposition of snapshots taken at t = 100 ns in simulations of the 2ATP (red) and ATPI_ADPII (blue) states. B: Time-series of the distance between the Q208 backbone center-of-mass of the two subunits. C, D: Close-up view of the bottom of helix 3 and helix 4. (C: 2ATP. D: ATPI_ADPII.) E: Time-series of the distance between G118 and G201.
