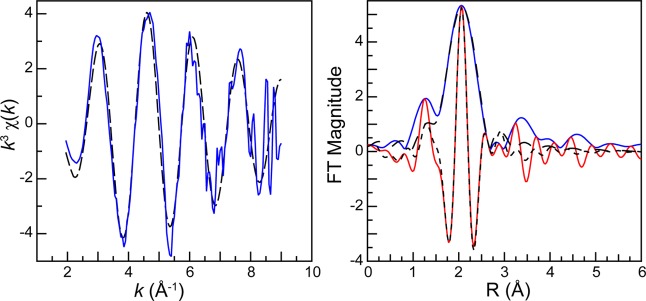
Figure 6.
Left: The room temperature solution-phase AcIII L3-edge EXAFS function k3χ(k) from the Ac-aquo ion (HO3SCF3, 0.11 M) (solid blue trace). Fit of the data is shown as a dashed black trace. Right: Fourier transform of k3-EXAFS spectra from the Ac-aquo ion (HO3SCF3, 0.11 M; blue trace) and its real part shown as the red trace. Fits to the data have been provided as dashed black traces.

