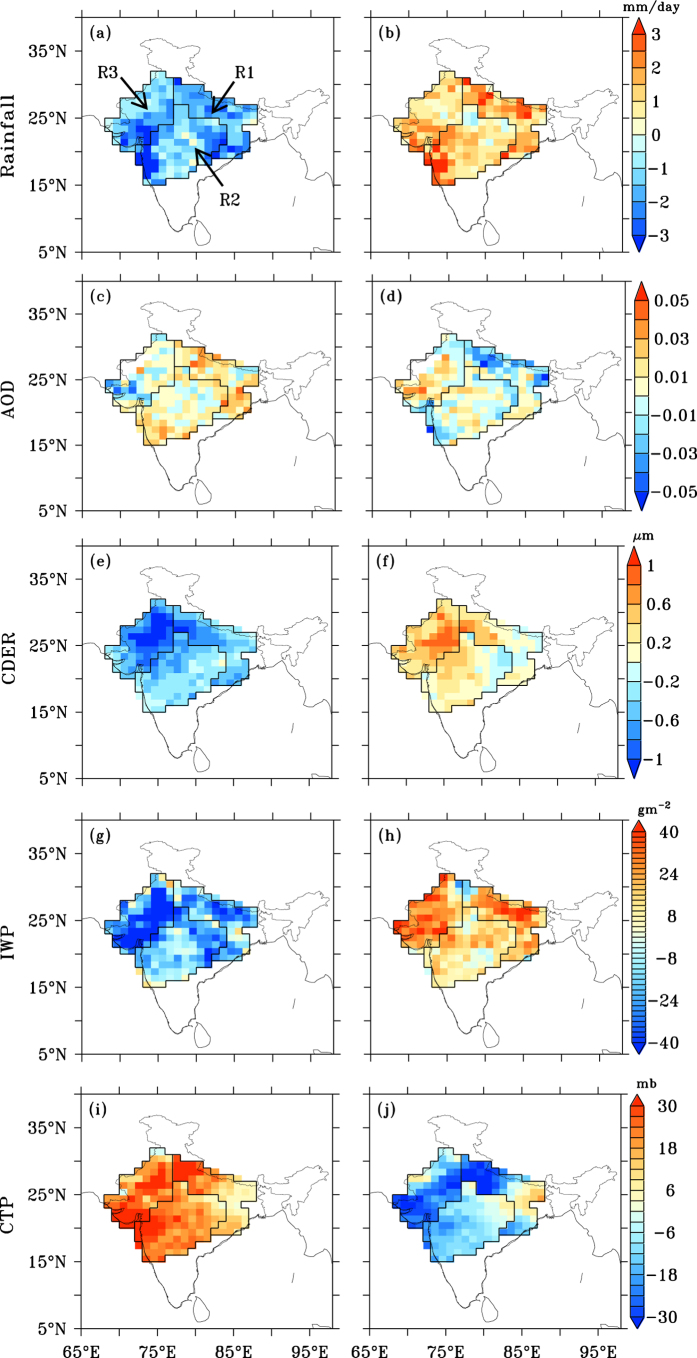
Figure 1. Spatial distribution of region-specific June–September (JJAS) anomalies during deficient (first column) and abundant (second column) rainfall years.
(a,b) rainfall, (c,d) aerosol optical depth (AOD), (e,f) cloud drop effective radius (CDER, μm), (g,h) ice water path (IWP, gm−2) and (i,j) cloud top pressure (CTP, mb). Figure was created using FERRET v7.0 (http://www.ferret.noaa.gov/Ferret/).

