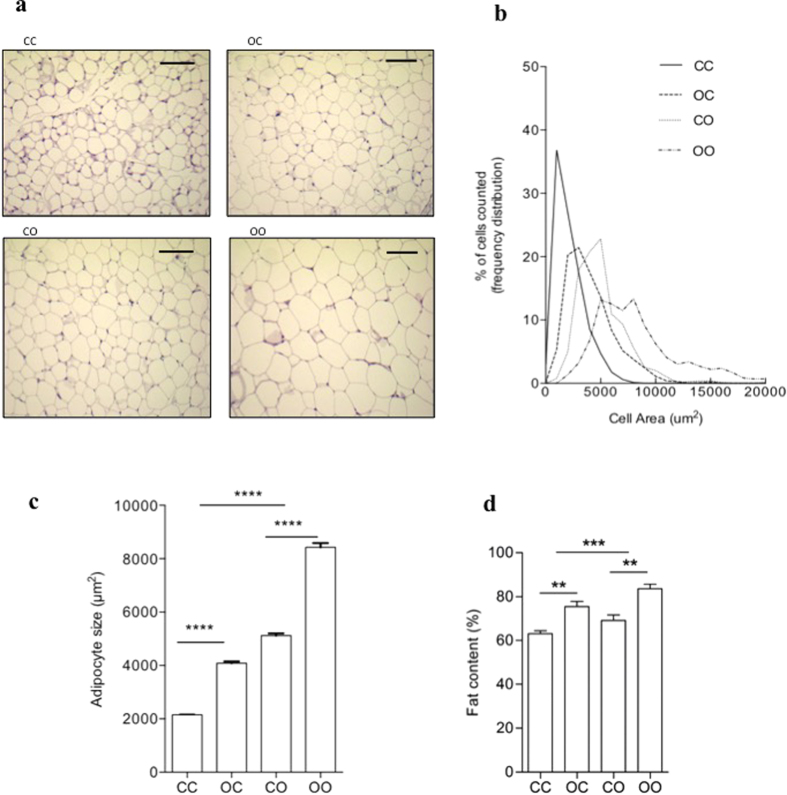
Figure 3. Maternal programming followed by post-weaning obesogenic diet enhance the size of adipocytes and its lipid accumulation.
Representative histological images for. (a) CC, OC, CO and OO offspring. Scale bar represents 100 μm. (b) Frequency distribution of cell groups and (c) Diameter of adipocytes (n = 5) shows effect of maternal diet ****p < 0.0001 and offspring diet ****p < 0.0001, with significant interaction ****p < 0.0001. (d) Total fat content (n = 5) shows effect of maternal diet **p < 0.01 and offspring diet ***p < 0.001, with no interaction.

