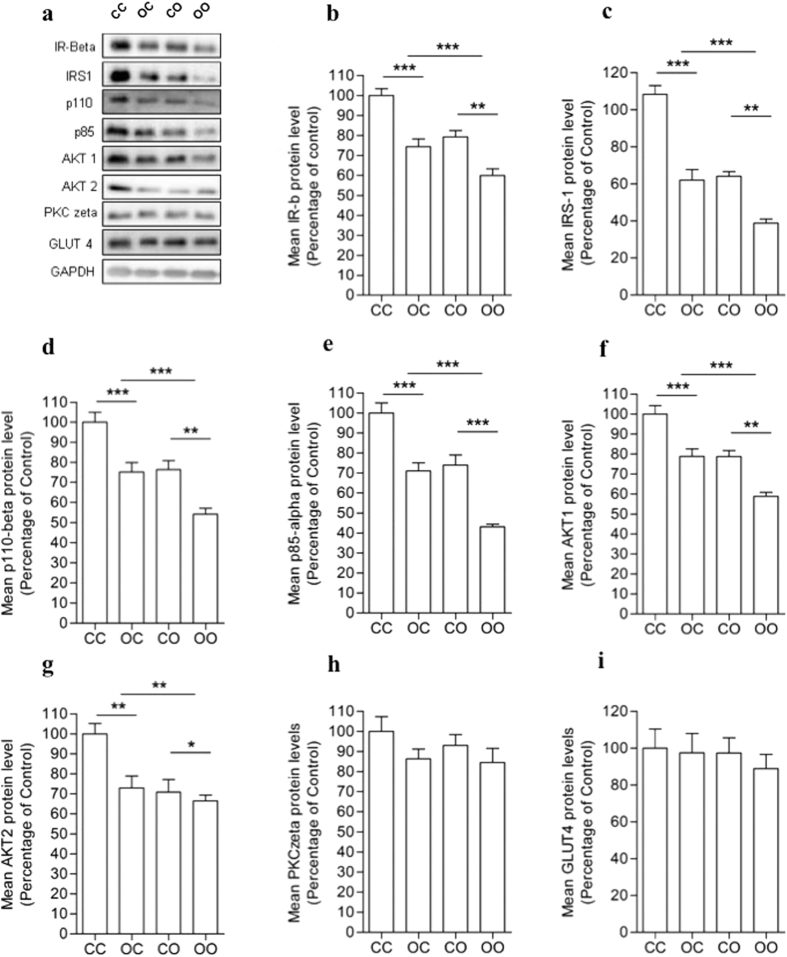
Figure 4. Nutritional programming exacerbates the effects of post-weaning obesogenic diet on insulin signaling pathway proteins.
(a) Representative image of protein expression. (b) IR-beta, (c) IRS-1, (d) PI3Kp110-beta, (e) PI3Kp85, (f) AKT1, (g) AKT2, (h) PKC zeta and (i) GLUT4 proteins in eWAT of 8 weeks-old male offspring. IR-beta, IRS-1, PI3Kp110, PI3Kp85 and AKT1 show effect of maternal diet ***p < 0.001, **p < 0.01 and offspring diet ***p < 0.001. AKT2 shows effect of maternal diet **p < 0.01, *p < 0.05 and offspring diet **p < 0.01. All effects shown were independent, with no significant interaction. Data presented as percentage of CC group ± SEM (n = 6). Full-length blots are presented in Supplementary Figure 1a.

