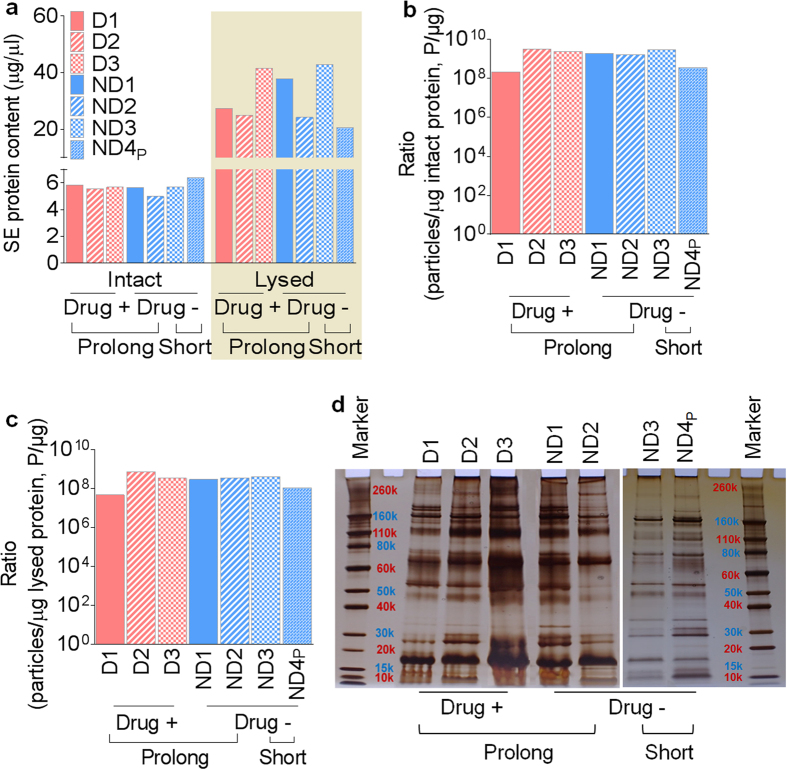
Figure 2. Protein concentration and electrophoretic patterns of SE from different donors at different freezing times.
(a) Protein concentrations as determined by Bradford analyses for intact and lysed SE. (b) Comparison of ratio of particles to intact protein across all donor samples and under different storage conditions. (c) Comparison of ratio of particles to total protein across all donor samples and under different storage conditions. (d) SE protein footprint analyzed by silver stain.

