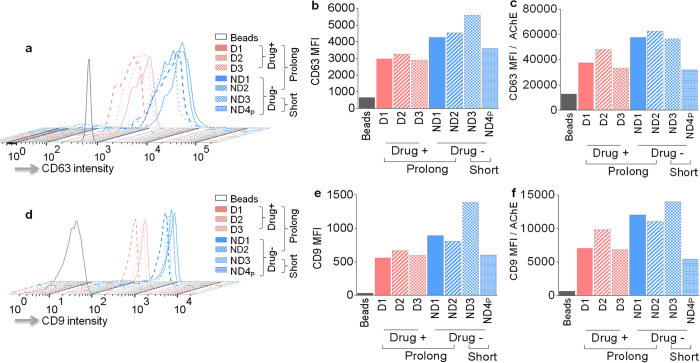
Figure 4. Levels of CD63 and CD9 on the surface of SE.
Analysis of SE-bound CD63 and CD9 was performed as described in the “Methods” section by binding of SE to anti-CD63 coated magnetic beads. CD63-bound SE were stained with human CD63 or CD9 and analyzed by flow cytometry. (a) Staggered histogram showing changes in CD63 on the surface of SE. (b) Mean fluorescence intensity (MFI) of CD63 on the surface of SE. (c) CD63 MFI normalized to baseline AChE. (d) Staggered histogram of CD9 levels on the surface of SE. (e) CD9 MFI on SE. (f) CD9 MFI normalized to baseline AChE.

