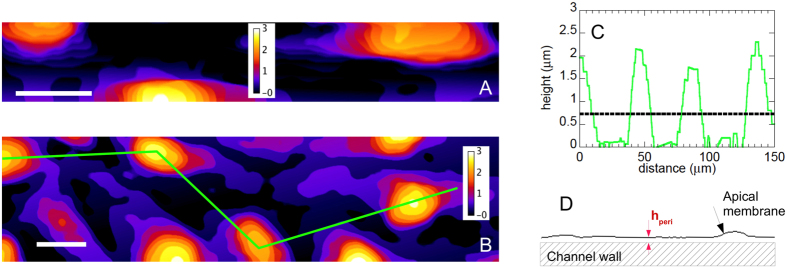
Figure 3.
Examples of height maps computed for (A) a side wall in a 30 × 30 μm channel, and (B) the bottom wall of a 60 × 30 μm channel. Scale bar : 15 μm. Height is color-coded as indicated by the scale in inset (unit: μm). (C) Height profile along the green line in (B). The horizontal dotted line indicates the value of the profile average height. (D) Sketch of the apical membrane of the endothelial cells, located at a minimum distance hperi of the channel wall.

