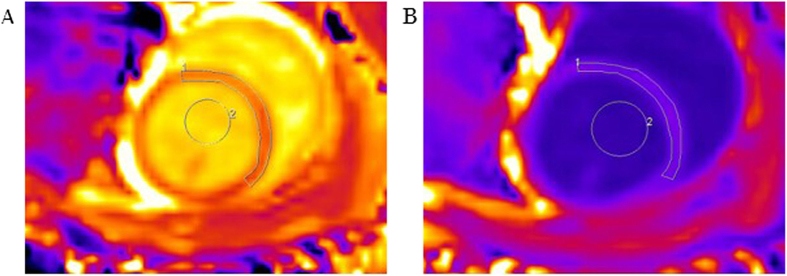
Figure 1. Representative T1 maps for a typical rabbit in the 6-months diabetes group.
(A) Pre-contrast T1 map. ROI 1 shows the T1 pre-contrast myocardium time: 1,330 ± 86 ms, and ROI 2 shows the T1 pre-contrast blood time: 1,876 ± 27 ms. (B) Post-contrast T1 map from the same level. ROI 1 shows the T1 post-contrast myocardium time: 513 ± 16 ms, and ROI 2 shows the T1 post-contrast blood time: 408 ± 6 ms. Hematocrit: 42%. The ECV calculated from pre- and post-contrast T1 maps is 36.2%.

