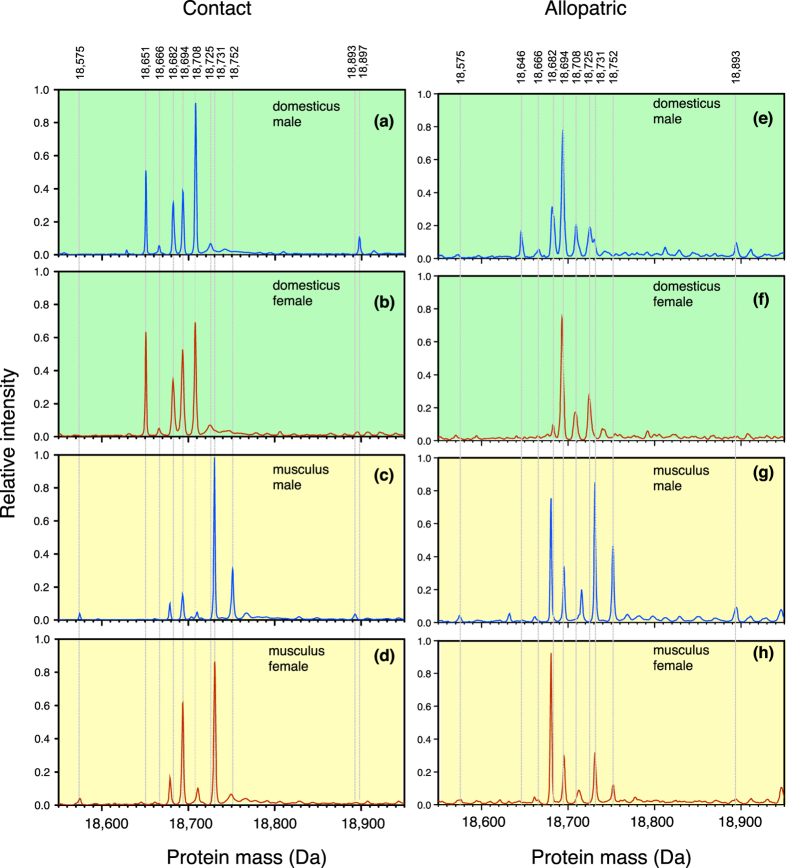
Figure 3. Intact mass profiling of central MUPs according to subspecies, sex and origin.
Overall profiles of central MUPs (analysed by electrospray ionisation mass spectrometry, ESI-MS), normalised to scale 0 to 1 and averaged across individuals of the same subspecies, sex and origin (contact or allopatric). Mass peaks shared by multiple individuals are indicated by grey dashed lines, with the mass labelled at the top of the figure. The peak height of darcin (18893 and 18897 Da) is reduced because it does not produce a strong signal on the instrument used for this analysis (see text).

