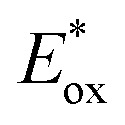
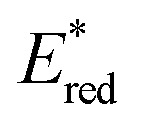
Table 1. Electrochemical data determined by cyclic voltammetry and square-wave voltammetry.
| E ox [V] | E red [V] | ΔE redox c [V] |
 d
[V]
d
[V] |
 d
[V]
d
[V] |
|
| 17 | +0.39 a | — | — | — | — |
| 18 | +0.58 a | — | — | — | — |
| 19 | +0.37 a | — | — | — | — |
| 3a b | — | –2.42 b | — | — | — |
| 1 | +1.32 | –1.73 | 3.05 | ≈–1.1 | ≈+0.7 |
| 2 | +1.11 | –1.89 | 3.00 | ≈–1.2 | ≈+0.4 |
aAll of the measurements were performed in room-temperature acetonitrile solution + 0.1 M TBAPF6. All of the redox potentials are referenced to the ferrocene/ferrocenium couple, which was used as an internal standard.
bAn irreversible redox process with an estimated error of ±0.05 V.
cΔE redox = E ox – ΔE red.
d
 where E
00 is the energy gap between the ground and excited states determined spectroscopically using the data reported in Fig. S4. Estimated error: ±0.1 V.
