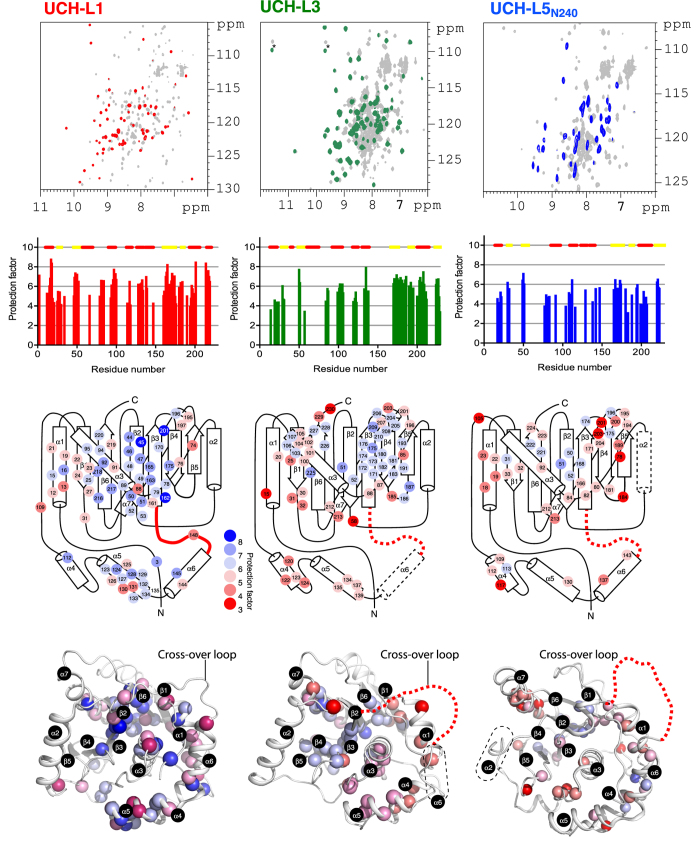
Figure 4. NMR HDX analyses of UCH-L1, UCH-L3 and UCH-L5N240.
Top panels: Overlaid 15N-1H HSQC spectra before (grey) and after ca. 30 minutes of HDX (red, green and blue for UCH-L1, -L3 and –L5N240, respectively). Aliased cross-peaks in UCH-L3 are indicated by asterisk. Second panels: NMR HDX-derived PFs as a function of residue number. Third panels: Topological mappings of the HDX PFs. The observed PFs are shown in filled circles and coloured from blue to red, corresponding to protection factor values from eight to three as indicted. The numbering of the secondary structures in UCH-L1 (PDB ID: 2ETL) is applied to UCH-L3 and -L5N240. Note that α-helix 6 (α6) and α-helix 2 (α2) are absent in the crystal structures of the apo forms of UCH-L3 (PDB ID: 1UCH) and the catalytic domain of UCH-L5 (PDB ID: 3RII), respectively. They are indicated in dashed lines in their respective topological representations. Bottom panels: Structural mapping of the HDX protections factors. The crystal structures of UCH-L3 and -L5N240 are superimposed to that of UCH-L1. The backbone amide nitrogen atoms of the residues of which the PFs can be determined are shown in spheres and coloured in the same scheme as that for the topological mappings. The cartoon representations of the crystal structures of UCHs are rendered by PyMol (http://www.pymol.org/).

