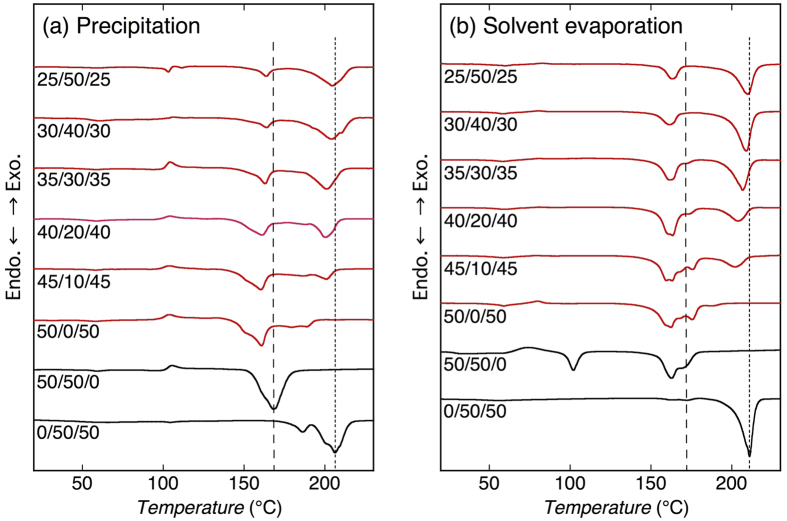
Figure 5.
DSC thermograms of blends crystallized by precipitation (a) and solvent evaporation (b). Shown ratios are those of D-PLA/L-P2HB/D-P2H3MB (mol/mol/mol). Dotted and broken lines in panels (a) and (b) indicate the Tm values for L-P2HB/D-P2H3MB HTSC crystallites in 0/50/50 blends and D-PLA/L-P2HB HTSC crystallites in 50/50/0 blends, respectively.

