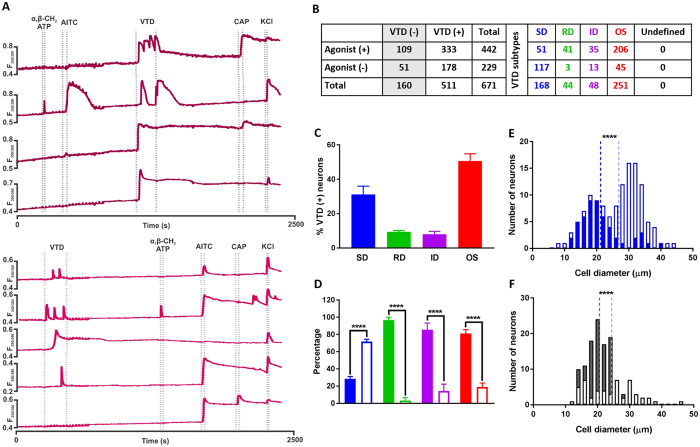
Figure 6. The Veratridine OS, ID and RD response profiles are enriched in nociceptors.
(A) Example traces from the two drug application protocols used. (B) Drug sensitivity and VTD response profiles of 671 neurons from N = 7 mice. (C) The frequency of occurrence of VTD profiles in the 511 VTD-responsive neurons shows the same order as in Fig. 2B. The OS profile is the most frequent (50.6 ± 4.2%) then the SD profile (31.2 ± 4.8%) followed by RD (9.4 ± 0.8%) and ID (8 ± 1.8%) (D) The proportion of neurons sensitive to at least one agonist (closed bars) and neurons insensitive to any (open bars) within the four VTD response profiles. Larger proportion of SD neurons (71.6 vs. 28.4 ± 2.9%) is insensitive to any of the three agonists. In contrast, Larger proportion of RD neurons (96.7 vs. 3.3 ± 3.3%), ID (85.5 vs. 14.5 ± 7.7%) and OS (81 vs. 19 ± 4.6%) neurons are sensitive to at least one of the three agonists. Percentages were calculated from total number of neurons in each profile (n(SD) = 168, n(RD) = 44, n(ID) = 48, and n(OS) = 251 neuron). Data shown are mean ± SEM. One-way analysis of variance with Sidak’s post-test, ***P < 0.001 and ****P < 0.0001. (E) Diameter of SD neurons that are sensitive to at least one of the three agonists (closed bars, mean 21.2 ± 0.9 μm, median 19.6 μm, n = 51 cell) is significantly smaller than that of neurons insensitive to any of the three agonists (open bars; mean 26.9 ± 0.7 μm, median 28.3 μm, n = 117 cell). (F) Diameter of VTD-unresponsive neurons sensitive to at least one agonist (closed bars are, mean 20.6 ± 0.4 μm, median 20.7 μm, n = 109 cell) and VTD-unresponsive neurons insensitive to any of the three agonists (open bars, mean 24.4 ± 1 μm, median 24.3 μm, n = 51 cell). In (E,F), dotted lines represent the mean. Two-tailed unpaired Student’s t-test, *P < 0.05.

