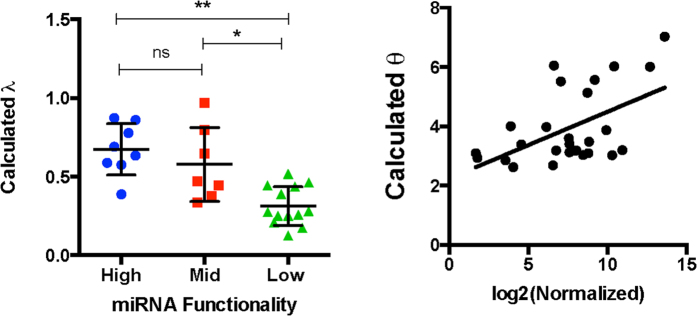
Figure 5. Molecular miRNA titration model describes functional groups and solves discrepancy of expression/repression by incorporating binding capability.
UTA transfer functions for tested miRNAs were fitted using non-linear least squares regression and λ and θ were extracted (A) Calculated 1/λ (~Kon) plotted versus different functional groups (P < 0.05 Kruskal-Wallis test, * < 0.05 ** < 0.01). (B) Expression in mean normalized counts from the three sequenced libraries vs. calculated (~miRNA).

