
Figure 15.
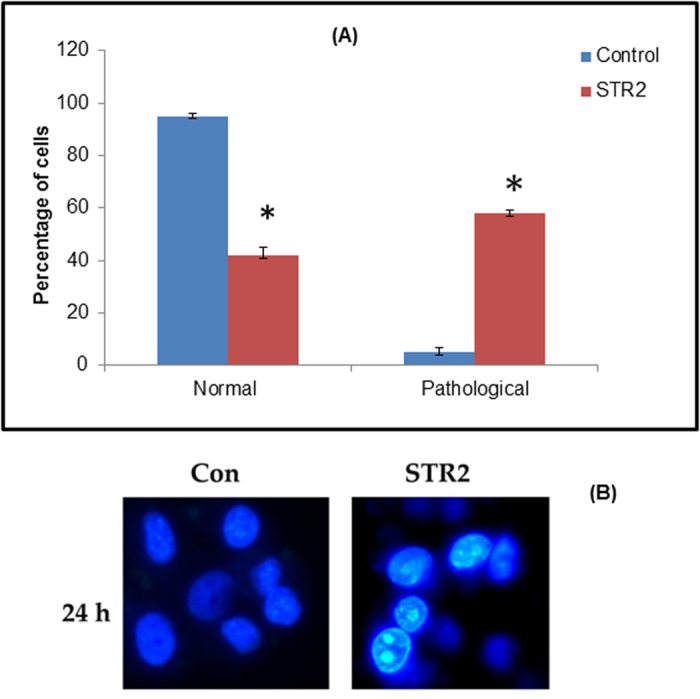
(A) Hoechst 33258 staining of the complex 1-induced apoptosis of HepG2 cells. The graph shows the manual count of apoptotic cells as a percentage (data are mean% ± SD% of three experiments). (B) Representative morphological changes observed in HepG2 cells treated with 1 (STR2) adopting Hoechst 33258 staining.