
Fig. 4.
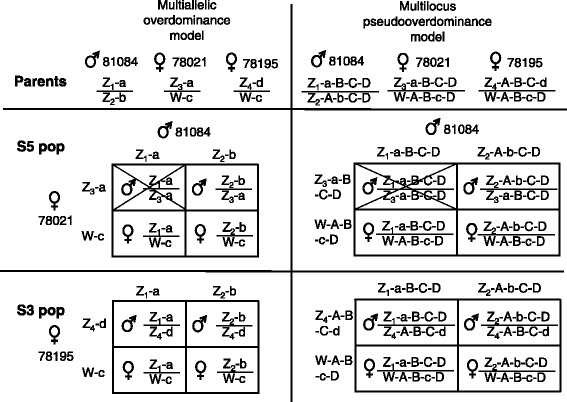
Conceptual figure showing how the multiallelic overdominance model (left) and multilocus pseudooverdominance model (right) work to make the parents (a) produce the marker and sex segregation patterns observed in the S5 (b) and S3 populations (c). Potentially lethal alleles are coded as small letters (e.g., Z-a-b-c-d) in contrast to alleles of with no adverse effect (Z-A-B-C-D). Sex-marker genotype combinations not observed and potentially being caused by incompatible/lethal genotypes are crossed over. Note: The particular examples in this figure show a sex-neutral version of the model where the W- as well as Z-gametologs may be associated with lethal alleles