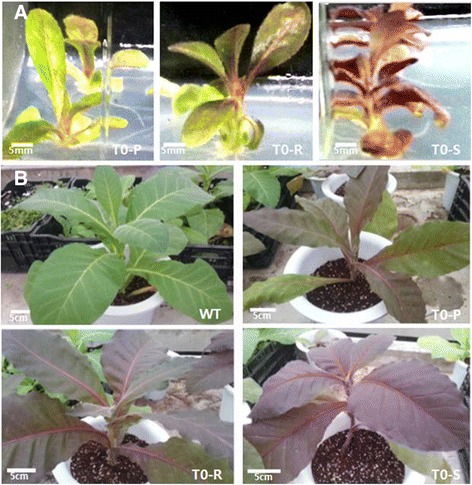
Fig. 1.

Comparing anthocyanin-content phenotypes across (a) three independent Del-overexpressing transgenic lines (in vitro stage) and across (b) WT and transgenic lines (in greenhouse conditions). All lines exhibited different phenotypes. T0-P, T0-R, and T0-S refer to pale red, red, and strong red transgenic plants in the T0 generation, respectively
