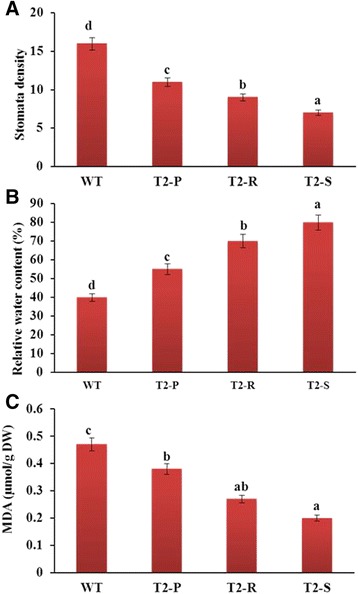
Fig. 10.

Comparison of leaf stomata density (a), relative water content (b), and MDA content (c) analyzed from the fifth top leaf of plants water-deprived for 10 days. Error bars indicate the standard errors (SE) of average results

Comparison of leaf stomata density (a), relative water content (b), and MDA content (c) analyzed from the fifth top leaf of plants water-deprived for 10 days. Error bars indicate the standard errors (SE) of average results