Fig. 2.

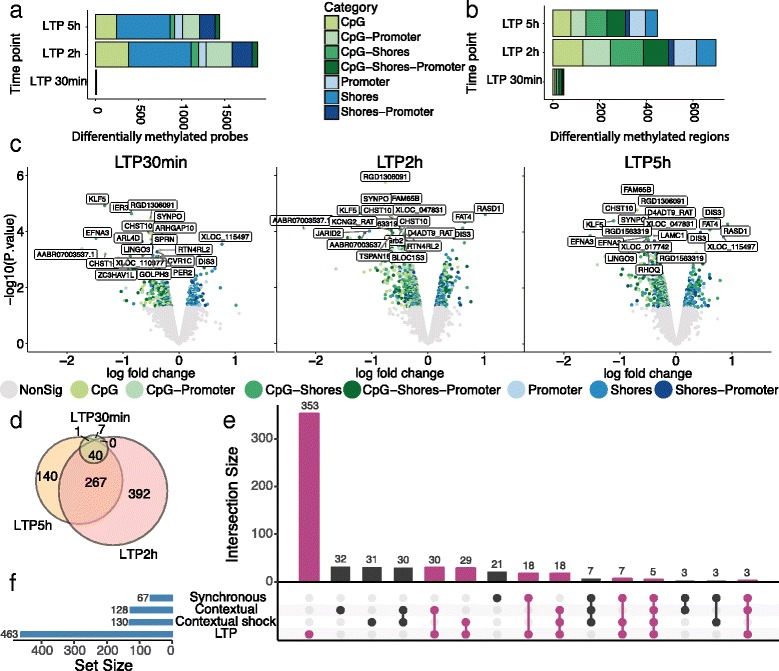
Differential methylation analysis reveals the majority of regions being downregulated in response to high-frequency stimulation. Number of differentially methylated (DM) (a) probes and (b) regions when comparing the stimulated samples with the controls. c Volcano plot showing the log2 fold change value plotted against the p-value for all regions per time point compared to control. Non-significantly methylated regions are coloured grey. The colours represent the different locations for each probe and region. The name of the top 20 differentially methylated regions for each time point are shown. d Venn diagram of DMRs from (c). e Comparison of methylation changes between LTP, single electroconvulsive stimulation [18], and contextual fear with our without shock [17]. f Total numbers of differentially methylated array-specific genes in each study. Only genes present in our methylation array were included, and all different methylated regions were collapsed into corresponding unique gene names. Bars in purple are overlaps with our LTP results
