Fig. 3.

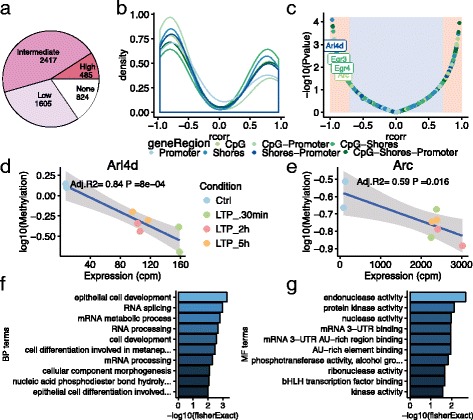
Correlation between methylation and expression status shows enrichment for RNA-splicing, kinase, and 3-UTR binding. a Effect of correlation between regions and their corresponding genes (b) Density plot of highly correlated genes (r ≥ 0.7 and p-value ≤ 0.05) (c) association between correlation value and p-value. Examples of LTP-associated genes (d) Arl4d and (e) Arc and the correlation between expression and methylation. Enrichment of (f) biological processes and (g) molecular functions of Methylation/expression correlated genes against non-correlated genes in the array
