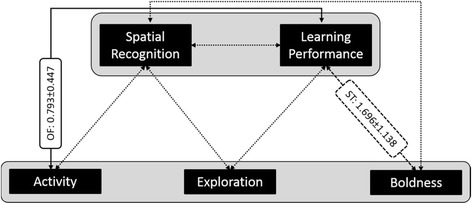
Fig. 4.

Relationship between personality and spatial cognition: Between-individual correlations (± standard errors) between personality traits and cognitive traits calculated from an eight-trait multivariate mixed model, but only five traits are displayed (see explanation in the text). The solid line indicates the significant correlation (p < 0.05) between activity in the Open Field (OF) and learning performance in the Spatial Orientation Task, the dashed line indicates the tendency (p < 0.1) between boldness in the Scare Test (ST) and learning performance in the Spatial Orientation Task, and dotted lines indicate non-significant correlations between the other traits
