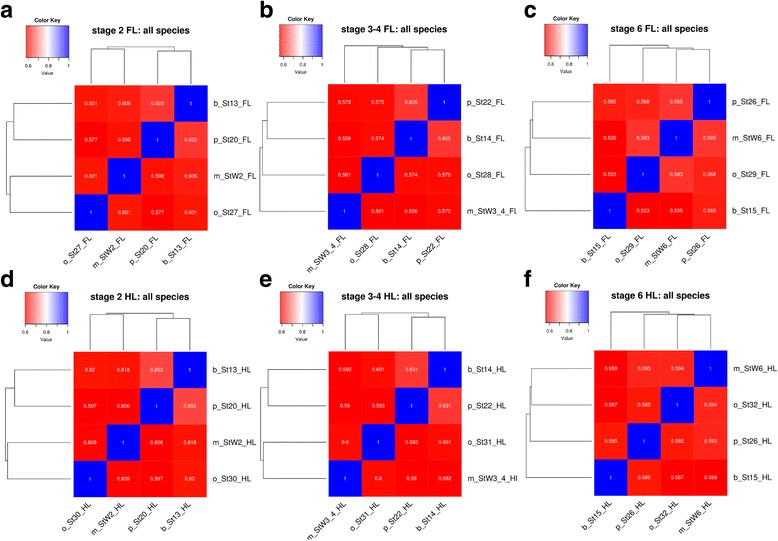
Fig. 3.

Similarity of gene expression profiles among species. Pairwise Spearman coefficient values for forelimbs at the (a), bud (b), paddle (c) stages for all species, and for the hind limbs of the ridge (d), bud (e), paddle (f) stages for all species. M. = mouse, O. = opossum. Abbreviations for stages and species are as in the legend for Fig. 2. In each label for the heat map, Stage 2 corresponds to ridge, Stage 3–4 to bud, and Stage 6 to paddle
