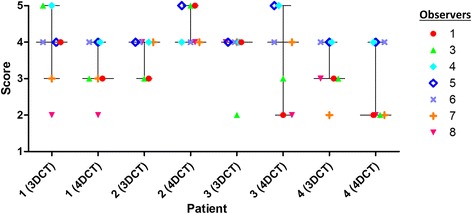
Fig. 5.

Scatterplot of the delineation difficulty rating by seven observers (observer 2 missing), showing the range, the median, 25th, 75th percentile for eight delineations. Rating varied between 1 = very easy; 2 = easy; 3 = moderate; 4 = difficult; 5 = very difficult. Colors are related to observers and are similar for Figs.1, 2 and 3
