Fig. 3.

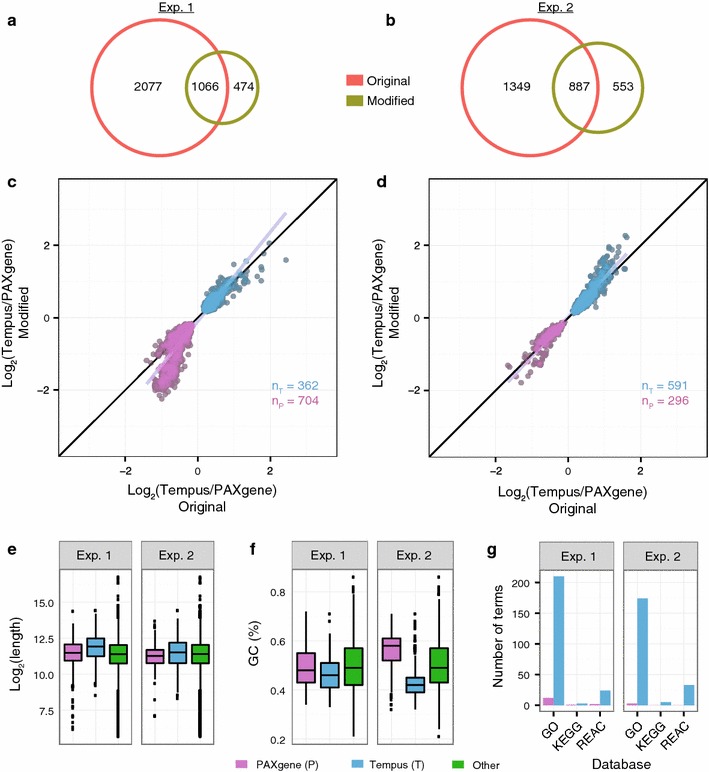
Comparison of protocols. a, b Venn diagrams showing the number of microarray probes having significantly different signals (p < 0.05) between PAXgene and Tempus systems for the original protocols (orange) and the modified protocol (olive) in experiment 1 (a) and experiment 2 (b). c, d Scatter plots showing the logFC values of the 1066 and 887 significant probes found in common between the protocols in experiment 1 (c) and in experiment 2 (d), respectively. Grey and black lines are linear regression fits to the data and idealized regression lines (logFC original = logFC modified), respectively. e Length and f GC content of transcripts preserved in PAXgene (logFC <0; purple) and in Tempus (logFC >0; blue) from c and d. All other transcripts (“Other”; green) are included as reference. See Fig. 2 for explanation of graphs. g The number of significantly enriched biological terms for transcripts preserved in the PAXgene and Tempus tubes
