Fig. 10.

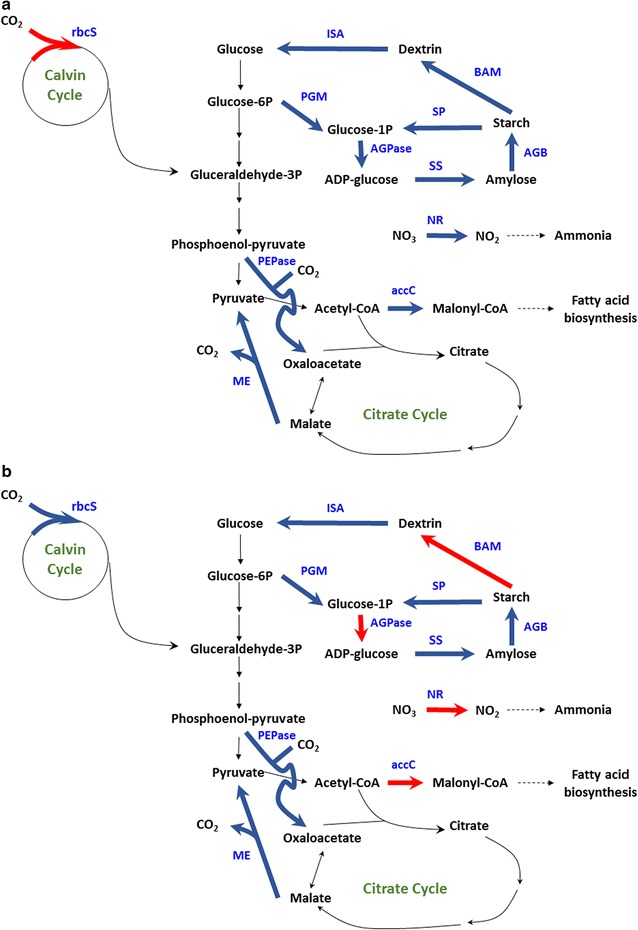
Metabolic regulation for CO2 fixation and starch accumulation at day 4 (a), day 5 (b). The gene expression patterns were shown in bold lines. The red means over-expressed and the blue means down-regulated

Metabolic regulation for CO2 fixation and starch accumulation at day 4 (a), day 5 (b). The gene expression patterns were shown in bold lines. The red means over-expressed and the blue means down-regulated