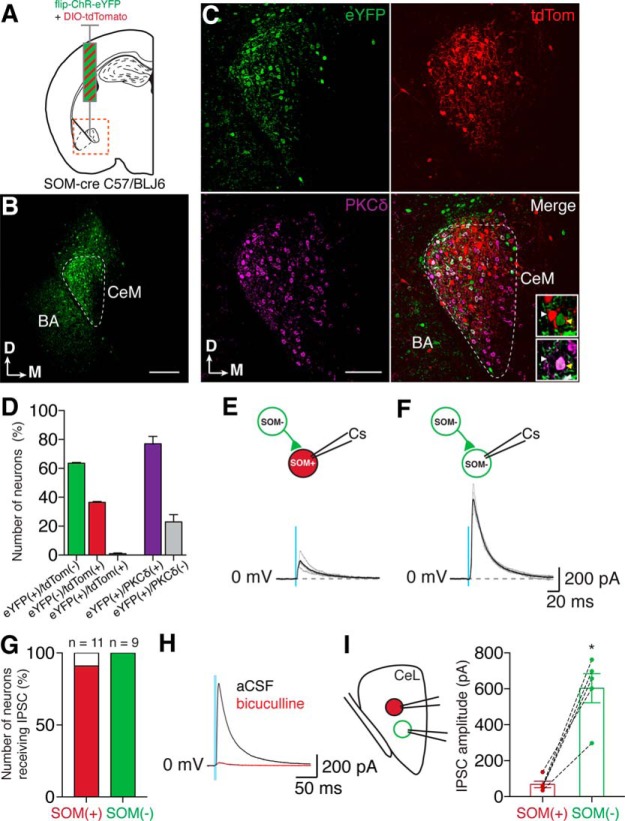
Figure 10.
Channelrhodopsin activation of SOM(−) terminals in the CeL of SOM-cre mice. A, to confirm whether SOM(−) neurons in the CeL also form local connections, we injected an AAV-forward-channelrhodopsin-eYFP mixed with an AAV-DIO-tdTomato into the CeL of SOM-cre mice; infected SOM(−) neurons express ChR2-eYFP but not tdTomato (tdTom), whereas SOM(+) neurons express tdTom but not ChR2-EYFP. B, Example image of maximal spread of ChR2-YFP expression at the injection site; the area shown corresponds to the orange square in A. Although the injection covered the majority of the CeL (outlined in white), eYFP(+) somas can still be seen above the CeL and in the BA. Scale bar, 200 µm. Dorsal (D) and medial (M) orientation are shown in the bottom left corner. C, Closeups of the CeL in slices that were also stained for PKCδ. ChR2-eYFP (green), tdTom (red), PKCδ (purple), and merged panels are shown (BA, basal amygdala). Scale bar, 100 µm. Insets in the merged panel show closeups of two neurons from a merged image of eYFP and tdTom stainings (top) and a merged image of eYFP and PKCδ staining (bottom). Arrowheads indicate the same neurons in both insets: a tdTom(+)/eYFP(−) neuron that was PKCδ(−) (white arrowhead), and a tdTom(−)/eYFP(+) neuron that was PKCδ(+) (yellow arrowhead). D, Neurons were counted; 62% were eYFP(+)/tdTom(−) (mean n = 67 ± 5 neurons/0.9 × 10−3 mm3), and 36% were eYFP(−)/tdTom(+) (mean n = 39 ± 4 neurons/0.9 × 10−3 mm3). Theoretically, there should be no overlap of eYFP(+) and tdTom(+) as the presence of Cre recombinase should either allow the expression of tdTom or prevent the expression of ChR2-eYFP. In reality, however, we did observe an overlap between eYFP(+) and SOM(+) neurons, although this was only ∼2% of fluorescently labeled neurons, which represented one to three neurons per 0.9 × 10⁻³ mm3 of CeL. The majority of eYFP(+) neurons were also PKCδ(+) (77%; mean, n = 51 ± 2 neurons/0.9 × 10−3 mm3), whereas 23% (mean, n = 16 ± 5 neurons/0.9 × 10−3 mm3) were PKCδ(−). E, F, Whole-cell recordings (CsMeSO4 internal solution) of SOM(+) (E) and SOM(−) neurons (F) revealed that both neuronal types displayed light-activated IPSCs from SOM(−) neurons (SOM(+) mean amplitude: 73.0 ± 19.7 pA; SOM(−) mean amplitude: 427.2 ± 77.8 pA). Example traces are shown with average traces in black and example individual traces in gray. G, Ten of 11 (91%) recorded SOM(+) neurons showed a response to light activation of SOM(−) terminals, whereas 9 of 9 of SOM(−) neurons received inhibitory terminals. H, Bicuculline (10 μm) blocked SOM(−)-driven IPSCs (aCSF mean amplitude, 375 ± 137 pA; bicuculline mean amplitude, 16 ± 7 pA; p = 0.03, one-tailed paired t test). I, As with our previous experiments, paired recordings between a SOM(+) neuron and a neighboring SOM(−) neuron allowed us to compare IPSC amplitudes from these two cell types (left diagram). These recordings showed that the amplitude of ChR2-driven SOM(−) → SOM(−) IPSCs was significantly greater than that of ChR2-driven SOM(−) → SOM(+) IPSCs (mean SOM(+) amplitude, 68 ± 18 pA; mean SOM(−) amplitude, 603 ± 81 pA; p = 0.002 unpaired t test, Welch’s correction).

